The network for creativity
Join 1.25M professional creatives like you
Connect with clients, get discovered, and run your business 100% commission-free
Creatives on Contra have earned over $150M and we are just getting started
Back to feedPost

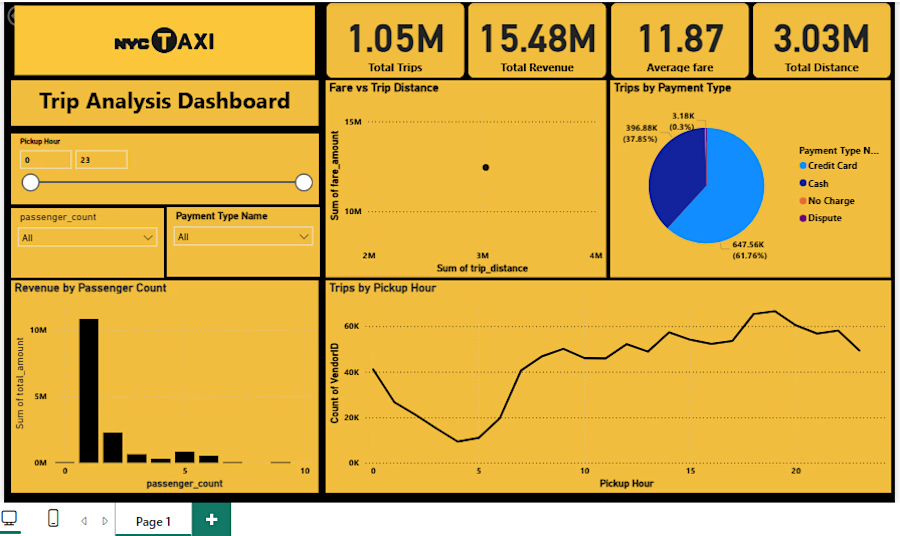
Explored over one million taxi trips for revenue analysis, payment methods, and passenger behaviour. Identified peak-hour demand using interactive visualisations.

The network for creativity
Join 1.25M professional creatives like you
Connect with clients, get discovered, and run your business 100% commission-free
Creatives on Contra have earned over $150M and we are just getting started


Related posts

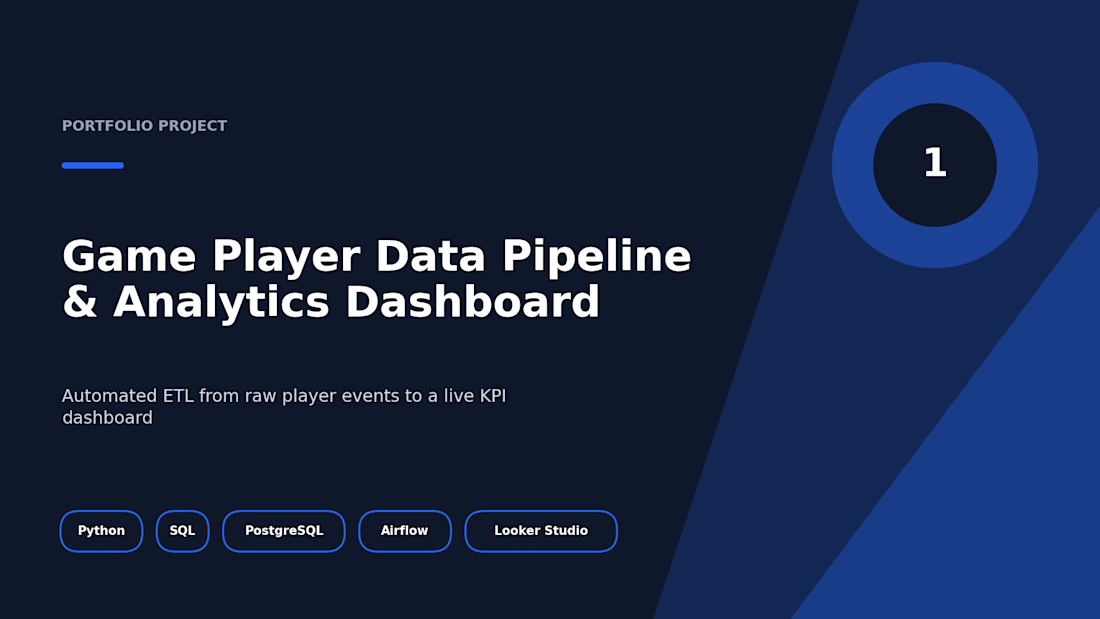
Game Player Data Pipeline and Dashboard



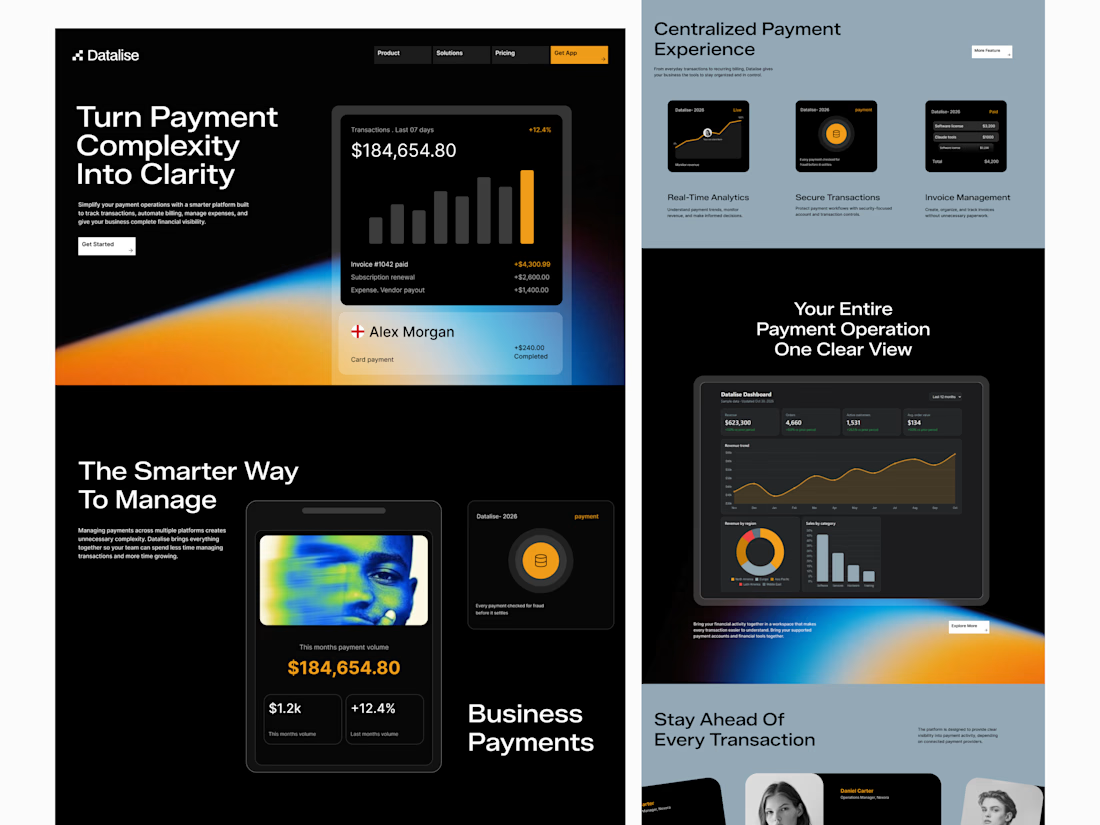
Datalise- Fintech payment Website Landing page
A modern payment management platform
The goal was to create a digital experience that makes complex financial workflows feel simple, clear, and effortless.
The Problem
Managing business payments across multiple platforms often creates unnecessary complexity. Businesses struggle with scattered transaction records, limited financial visibility, disconnected payment tools, and time-consuming invoice management.
Without a centralized system, tracking financial activity and making informed decisions becomes harder than it should be.
The Solution
Datalise brings essential payment operations into one unified experience. By combining real-time analytics, secure transaction monitoring, and simplified invoice management, the platform helps businesses stay organized and in control.
What's inside:
> Centralized payment management
> Real-time financial analytics
> Secure transaction monitoring
> Smart invoice management
> An intuitive business dashboard
> Built around a bold visual identity, clean layouts, and a data-focused interface that puts clarity first.
Have a payment platform that needs a better digital experience? Let's build something exceptional.



Sharp colour palette.

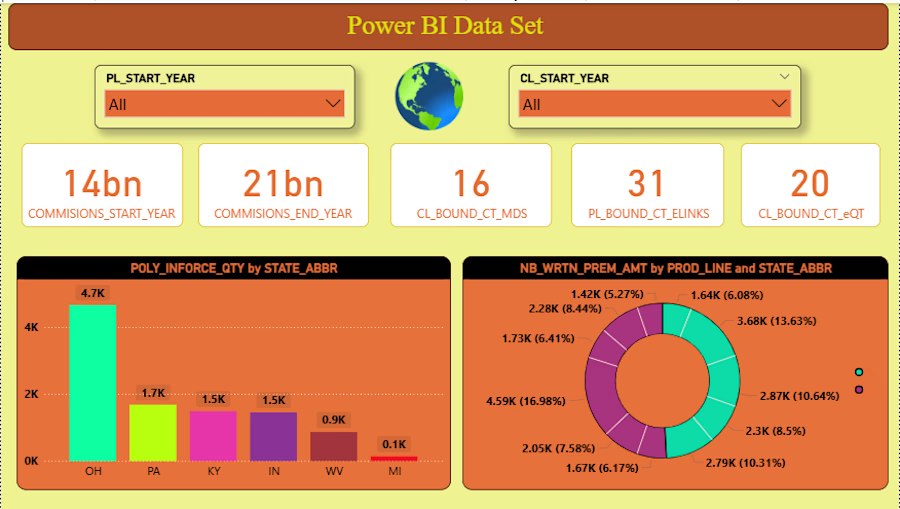
Power BI Project Description🩻
Sales Performance Dashboard | Power BI🙌
Developed an interactive Power BI dashboard to analyze sales performance, customer behavior, and business KPIs. The solution transforms raw data into actionable insights through dynamic visualizations and automated reporting.
Key Features:
Interactive KPI cards for Revenue, Inforce Policy Orders, and Growth
Sales analysis by State, Product Category, and Policy Segment
Dynamic slicers and drill-through functionality
Year-over-Year (YoY) performance tracking
Profitability and trend analysis using DAX measures
Data modeling with relationships and star schema design
Automated data refresh and optimized report performance
Tools & Technologies:
Power BI Desktop
Power Query
DAX
SQL / Excel Data Sources
Data Modeling & Visualization
Skills Tags🔥
Power BI • DAX • Power Query • Data Visualization • Business Intelligence • Dashboard Design • SQL • Data Analytics