
Hilal AKBAŞ
Data Analyst | Power BI, SQL, Python & Excel | Dashboards
New to Contra
Hilal is ready for their next project!
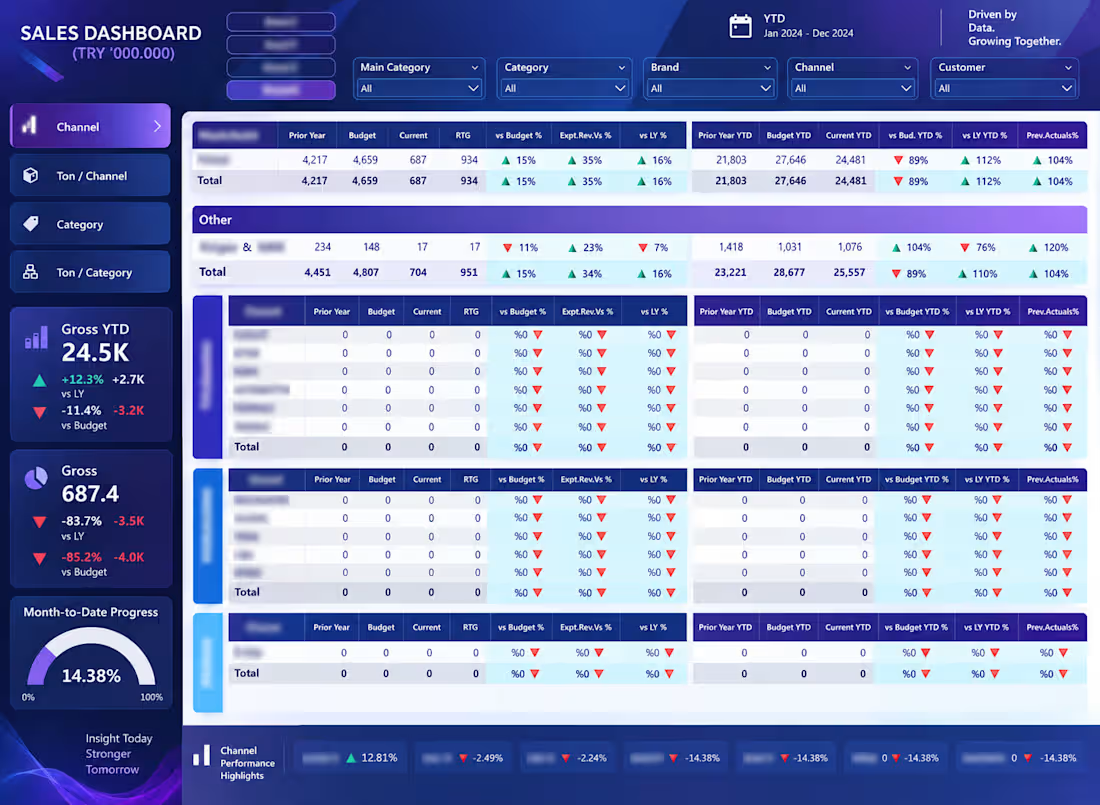
Sales Performance & Channel Analytics Dashboard
Developed an interactive Power BI dashboard to monitor sales performance across different channels, categories, brands, and customer segments. The dashboard provides insights into current performance, budget attainment, year-over-year growth, YTD results, and channel-level performance through interactive filters and detailed reporting tables.
0
10
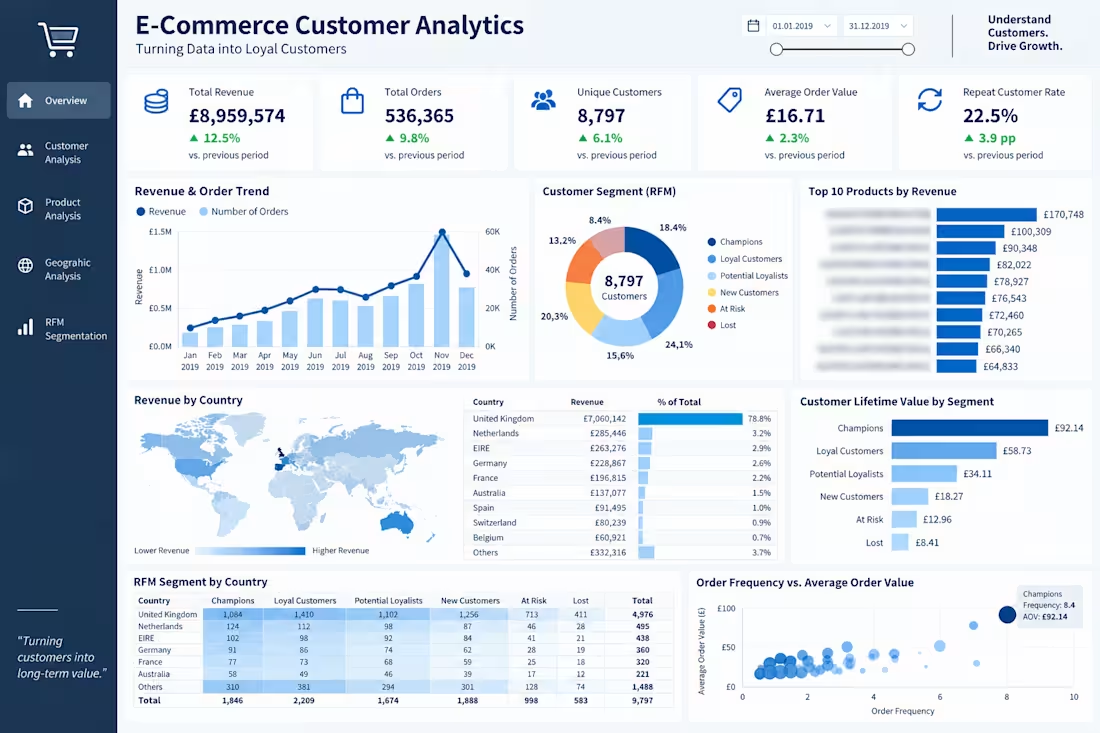
E-Commerce Customer Analytics Dashboard
Built an interactive Power BI dashboard to analyze e-commerce sales and customer behavior. The analysis covers revenue trends, customer segmentation using RFM analysis, repeat customer behavior, product performance, geographic sales distribution, and customer lifetime value. The dashboard transforms transactional data into actionable business insights to support customer retention and revenue growth.
0
12
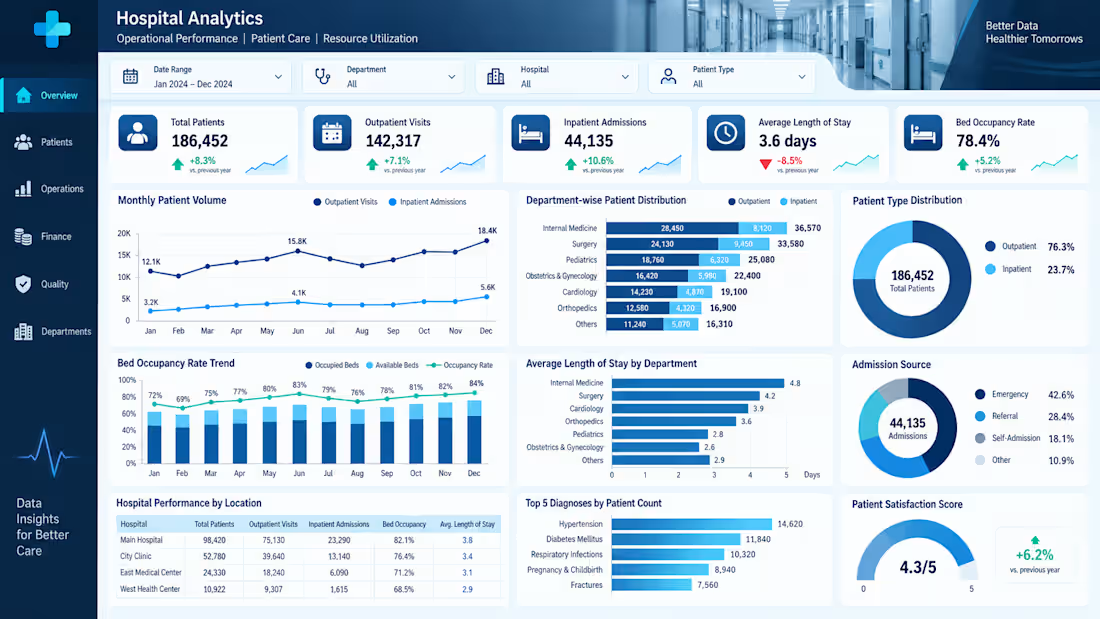
A healthcare analytics dashboard designed in Power BI to monitor patient activity, hospital operations, and resource utilization. The dashboard provides interactive insights into patient volume, admissions, bed occupancy, length of stay, department performance, diagnoses, and patient satisfaction using a structured healthcare dataset.
0
17
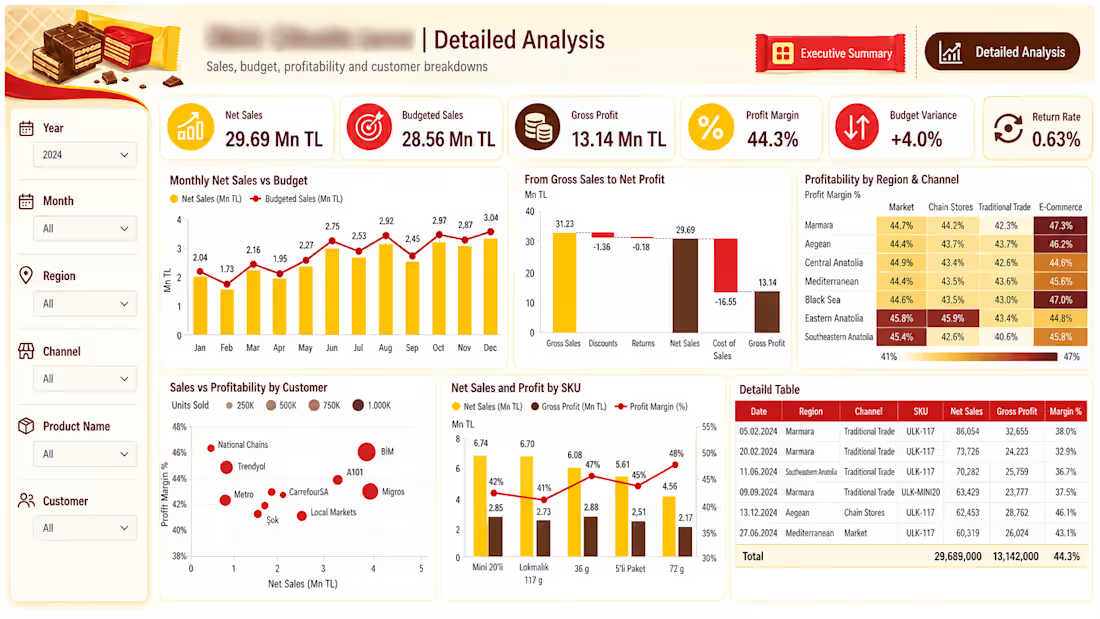
Developed an interactive Power BI dashboard to analyze sales performance, budget achievement, profitability, and customer/channel dynamics using a large-scale dataset extracted from SAP.
The dashboard provides an executive-level overview of key KPIs while allowing users to drill down by time, region, sales channel, customer, and SKU. It includes monthly sales vs. budget analysis, gross-to-net sales and profit bridge analysis, regional and channel profitability comparisons, customer-level performance, and SKU-level profitability analysis.
The project focused on transforming raw transactional data into a structured analytical model and presenting complex business data through clear, decision-oriented visualizations.
Key areas covered:
* Sales & budget performance
* Gross profit and profit margin analysis
* Regional & channel profitability
* Customer performance
* SKU-level sales and profitability
*Return and budget variance analysis
* Interactive filtering and drill-down analysis
Tools: Power BI, SAP, SQL, Data Modeling, DAX, Data Visualization
0
10