The network for creativity
Join 1.25M professional creatives like you
Connect with clients, get discovered, and run your business 100% commission-free
Creatives on Contra have earned over $150M and we are just getting started
Back to feedPost

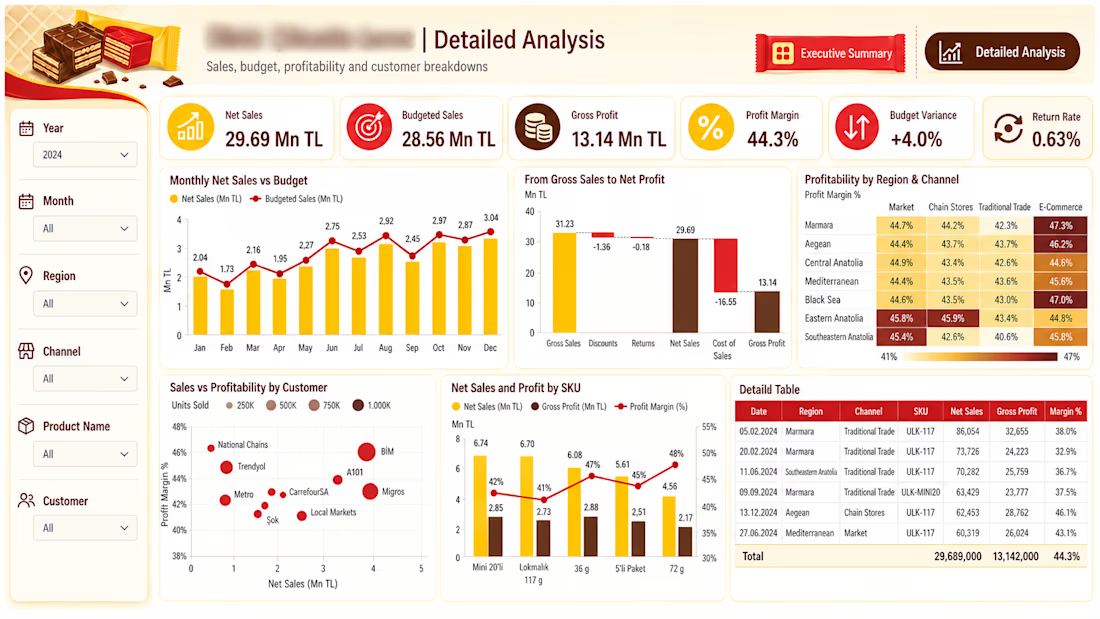
Developed an interactive Power BI dashboard to analyze sales performance, budget achievement, profitability, and customer/channel dynamics using a large-scale dataset extracted from SAP.
The dashboard provides an executive-level overview of key KPIs while allowing users to drill down by time, region, sales channel, customer, and SKU. It includes monthly sales vs. budget analysis, gross-to-net sales and profit bridge analysis, regional and channel profitability comparisons, customer-level performance, and SKU-level profitability analysis.
The project focused on transforming raw transactional data into a structured analytical model and presenting complex business data through clear, decision-oriented visualizations.
Key areas covered:
* Sales & budget performance
* Gross profit and profit margin analysis
* Regional & channel profitability
* Customer performance
* SKU-level sales and profitability
*Return and budget variance analysis
* Interactive filtering and drill-down analysis
Tools: Power BI, SAP, SQL, Data Modeling, DAX, Data Visualization


The network for creativity
Join 1.25M professional creatives like you
Connect with clients, get discovered, and run your business 100% commission-free
Creatives on Contra have earned over $150M and we are just getting started
Trending
retrofuturism
Share your favorite designs from the past exploring the distant future. Or your own take on the aesthetic 🚀
halftone
Dots. Texture. Grain. Let's see your designs using the halftone technique.

Midjourney
Creatives are showing off what they're making with Midjourney.
colorgrade
Video editors sound off: How do you enhance the mood of your video in color grading?





Related posts

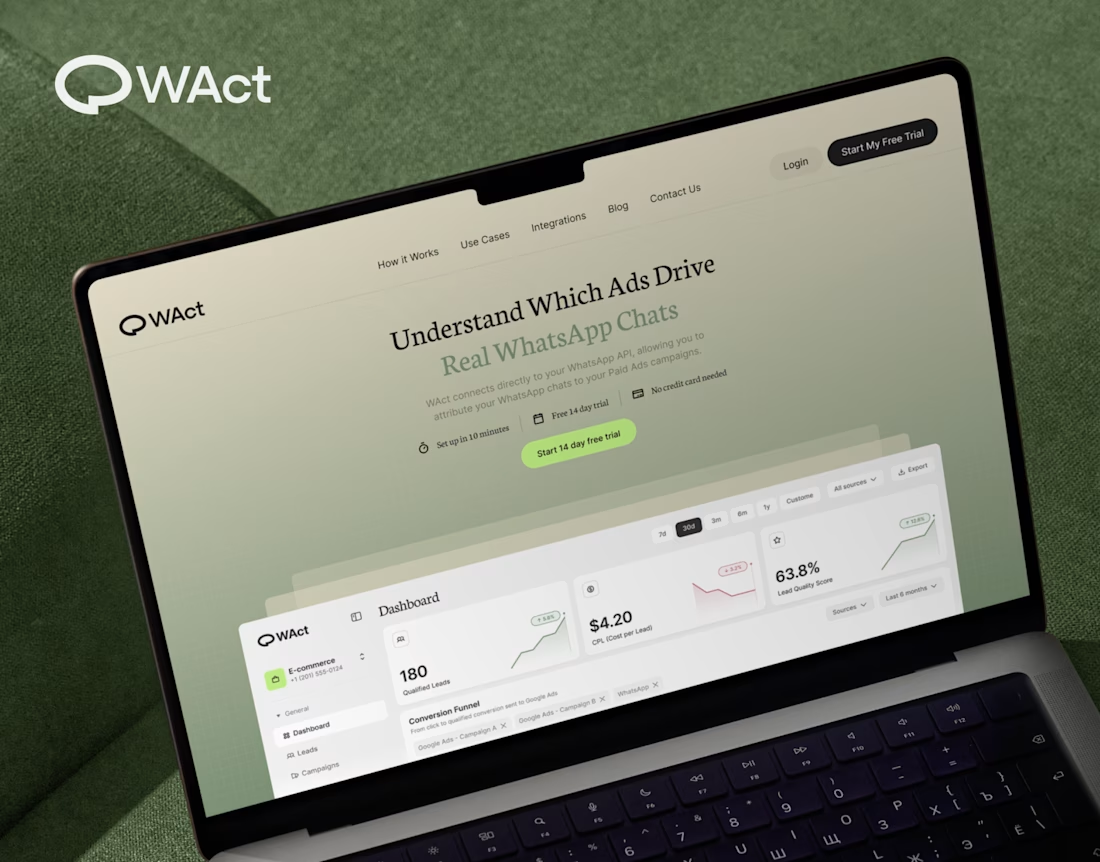
When designing WAct, the main challenge was to make complex analytics feel calm, approachable, and actionable.
Marketing tech platforms often suffer from visual noise: endless charts, aggressive contrast, and buried data.
For WAct, I took an editorial SaaS approach:
Visual Hierarchy: Kept the primary metric cards (CPL, Lead Quality Score) instantly readable at a glance.
Warm Aesthetic: Used a soft, olive-green gradient backdrop paired with editorial typography to make the brand stand out from generic blue dashboard templates.
Dashboard Logic: Structured the flow so users can track multi-channel ad conversions straight into WhatsApp chats without getting overwhelmed.
Building a complex B2B platform or analytics tool? Let’s connect and create a seamless UI/UX for your product.
🔗 Explore the full case study on Behance:
Check out WAct on Behance



this is nice

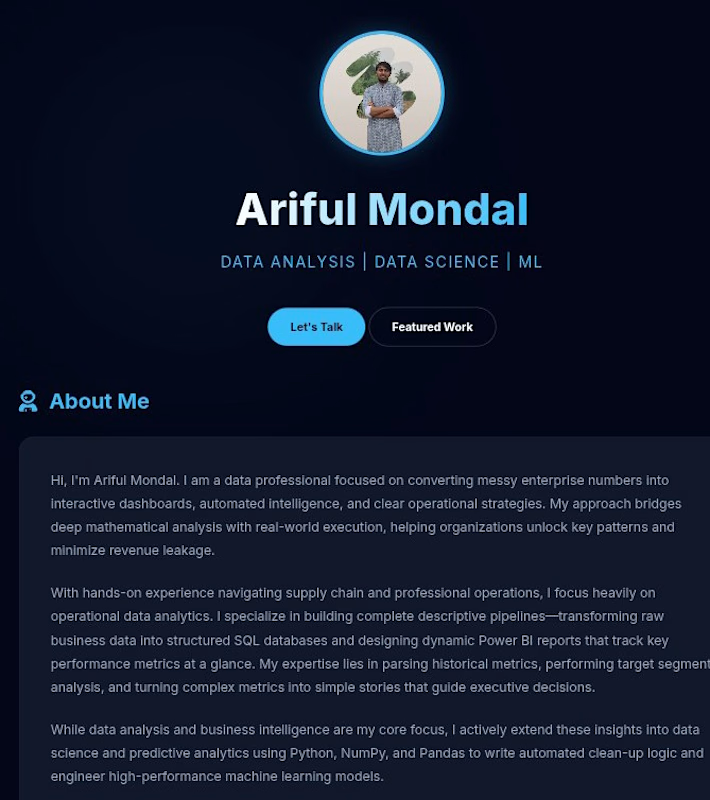
Data & Business Analyst | Turning raw data into decisions
Hi, I'm Ariful — a Data/Business Analyst with hands-on experience in supply chain operations and a growing skill set in Machine Learning, Deep Learning, and BI.
I work with Python, SQL, Power BI, and Excel to turn messy operational and financial data into predictive models and clear, actionable dashboards. Currently expanding into Generative AI (LangChain, HuggingFace).
Open to freelance work in data analysis, business analytics, and supply chain analytics.
Portfolio: https://ariful579.github.io

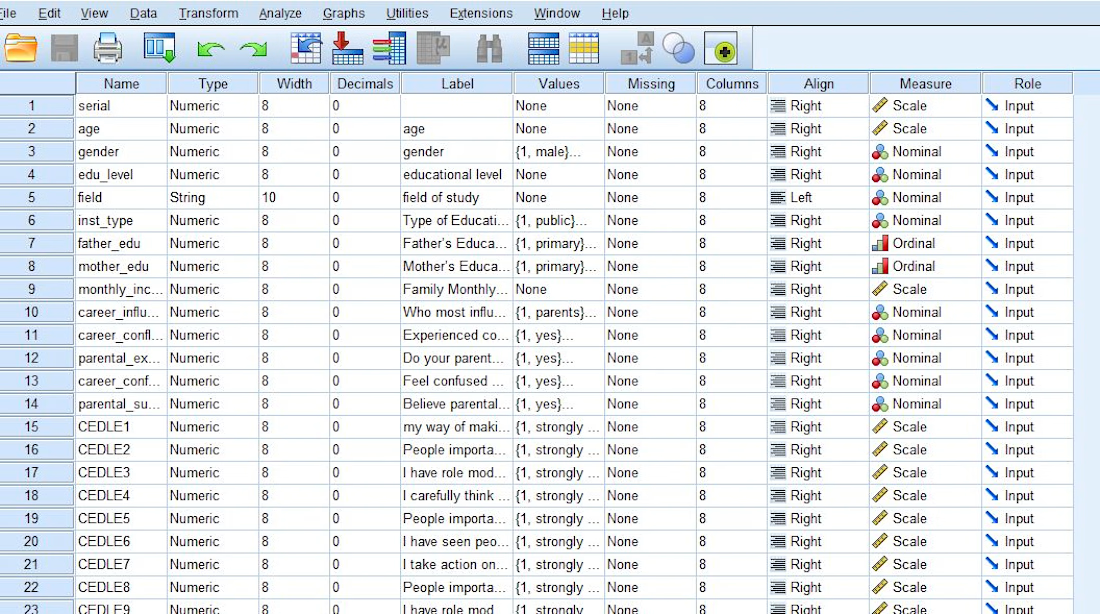
Organized and coded research variables in IBM SPSS , defining variable names, labels, measurement levels, and coding values to prepare the dataset for statistical analysis.