
Hassan gegu
Geospatial Engineer | Web Maps & Spatial Analysis
New to Contra
Hassan is ready for their next project!
A full stack geospatial estate management tool built for CBN Quarters, Abuja. Custom Revit-derived 3D building models are placed at real-world coordinates on a live satellite map. Estate managers can click any building to log block details, flat numbers, residents, occupancy, and photos, all persisted to a cloud database in real time.
What was built:
→3D satellite map with accurate estate boundary overlay
→16 custom GLB buildings placed, rotated, and labelled via an in-browser admin mode
→Full estate directory, block names, flat numbers, resident names, occupancy tracking per unit
→Block photo upload stored to cloud storage
→Token-gated admin system — one password to place/move/edit/rotate buildings and edit directory entries
→Mobile-responsive with touch-optimized panel interactions
Stack: Mapbox GL JS · Three.js · Supabase (PostgreSQL + Storage + RLS) · Vanilla JS · Vercel
1
19
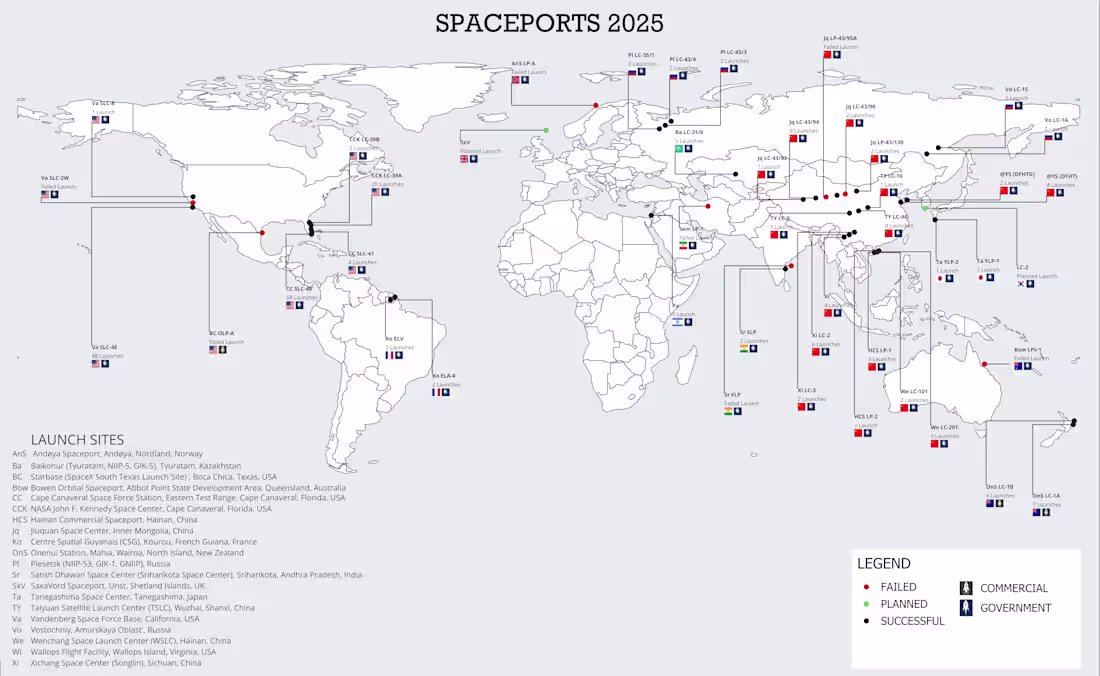
This project started as a minimalist global map of spaceports built in QGIS. I researched worldwide spaceport locations, compiled them into a structured CSV dataset, and brought them into QGIS to produce a clean, modern cartographic design inspired by contemporary data visualization aesthetics. The emphasis was on clarity and visual balance, making the final map suitable for presentations, reports, and visual storytelling.
I later converted it into a fully interactive web map using Python, Folium, and Leaflet. The app loads spaceport data via CSV upload with a built-in demo mode for instant preview. Users can filter by country and launch success, explore interactive popups with launch details, and navigate dense locations through marker clustering. The map was deployed publicly on GitHub Pages.
2
76
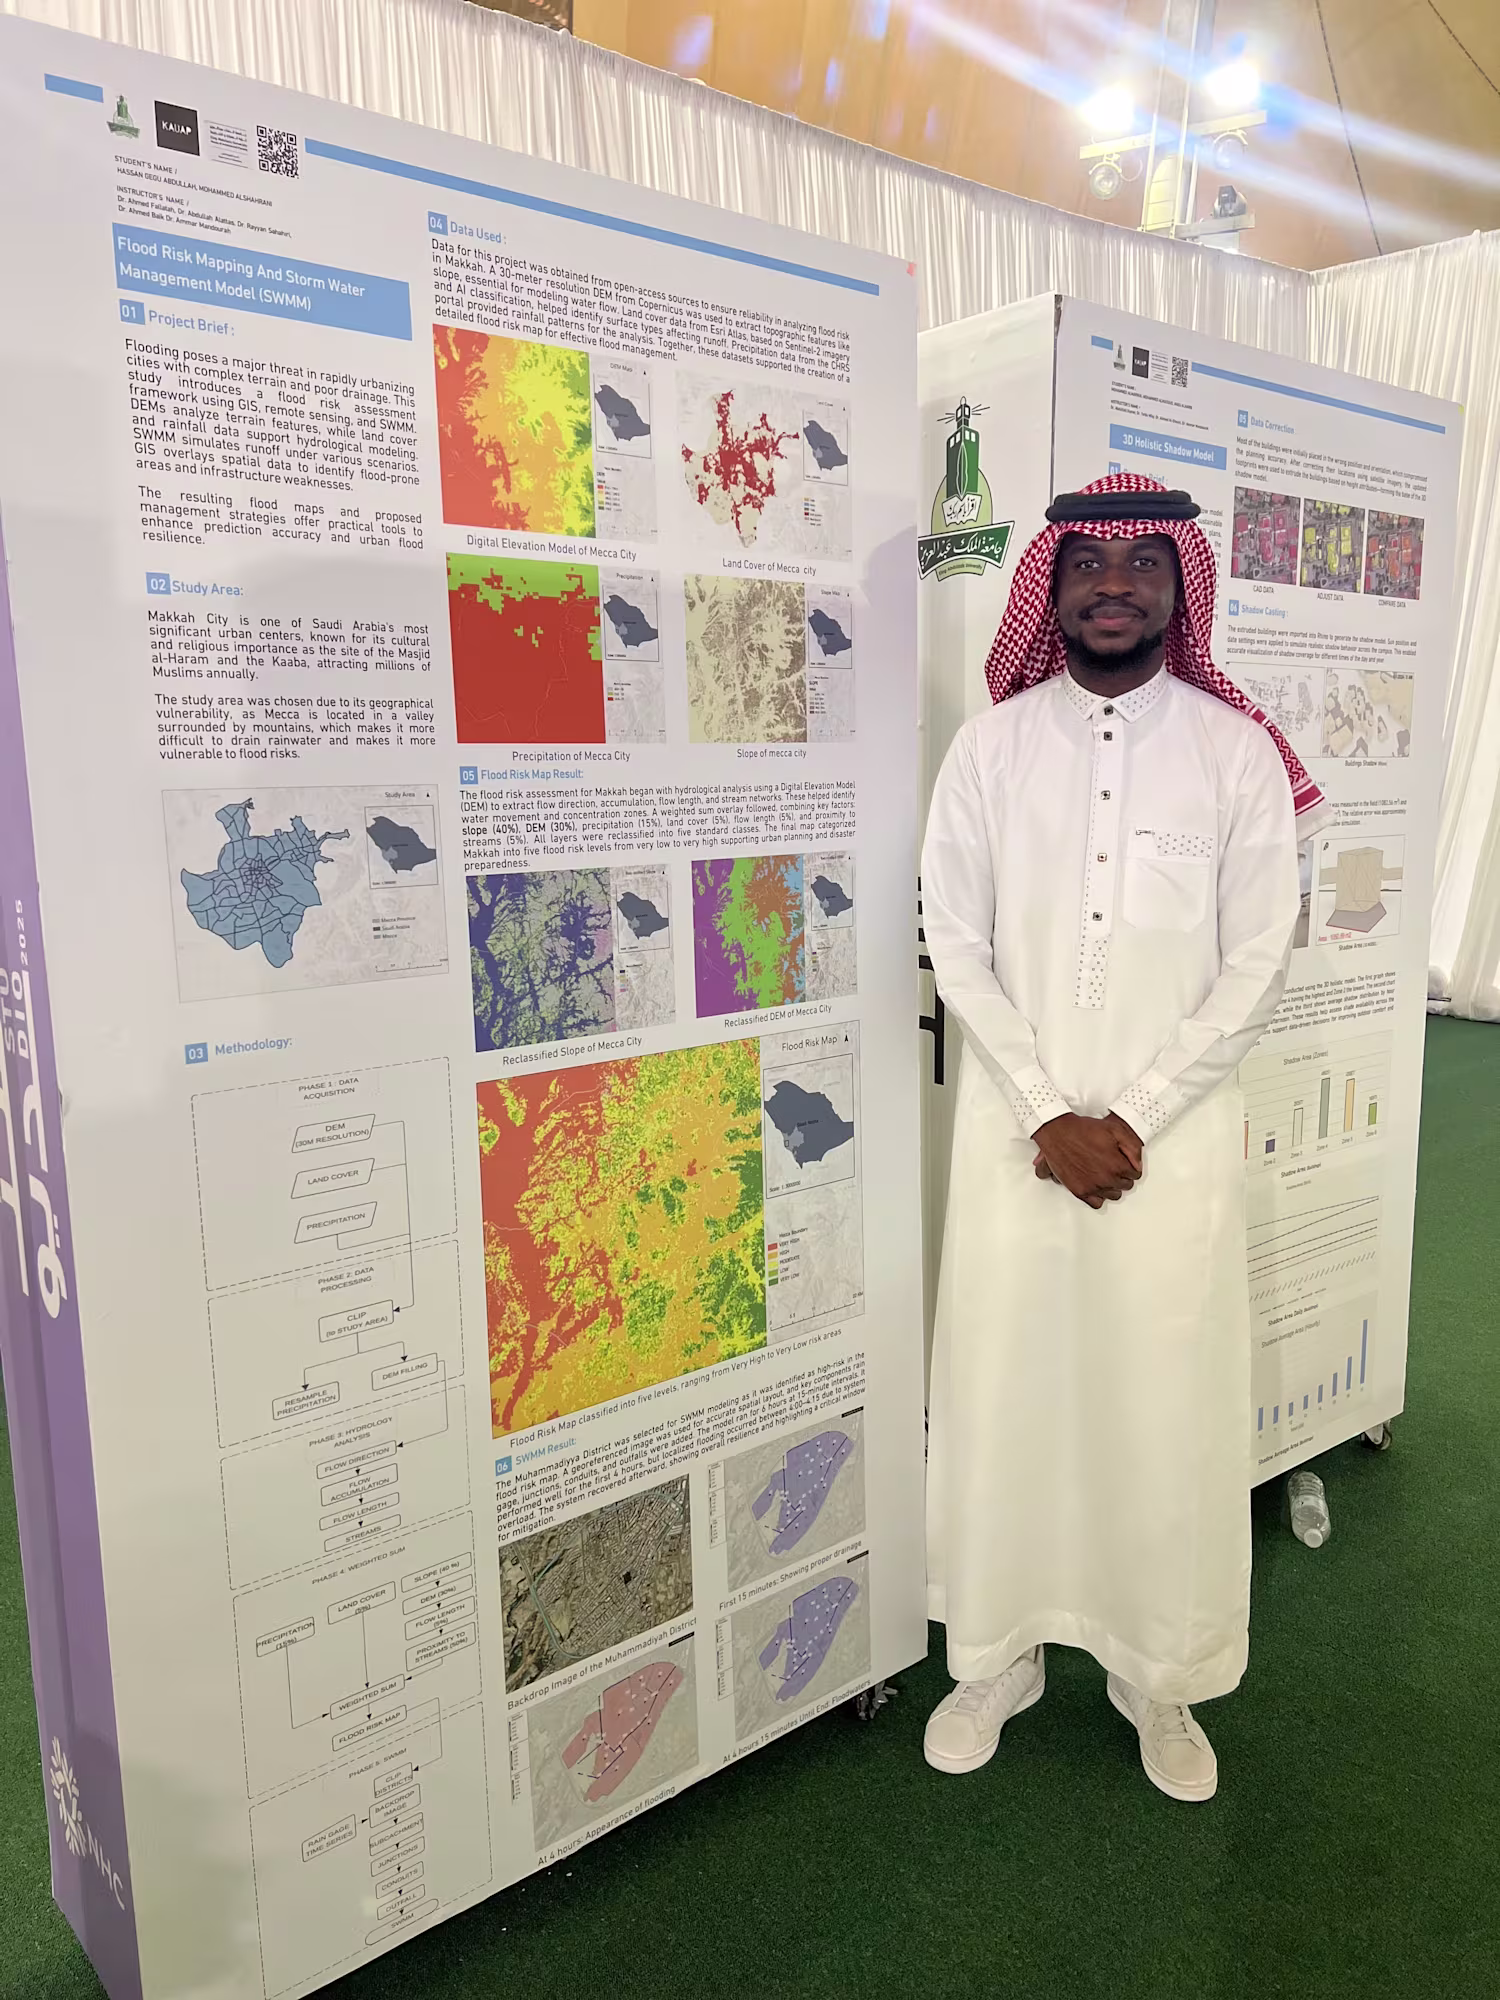
This project maps flood risk across Makkah City using GIS analysis, remote sensing, and hydrological modeling. I combined a 30m SRTM DEM, land cover classification, slope analysis, precipitation data, and SWMM simulations into a weighted overlay that classified the entire city into five flood risk levels. The final static map was featured by Al Yaum, a Saudi national newspaper.
I later converted the analysis into a fully interactive 3D web map using Mapbox GL JS. The app renders live SRTM terrain with adjustable exaggeration, extruded 3D buildings, and classified risk zone overlays that users can filter by class directly from the legend. It also includes a cinematic six-waypoint flythrough of the study area, fly-to presets for key locations including Al Haram Mosque, and basemap switching between satellite, dark, and light modes. The entire application runs as a single HTML file with no build tools or dependencies, deployed on Vercel.
1
74
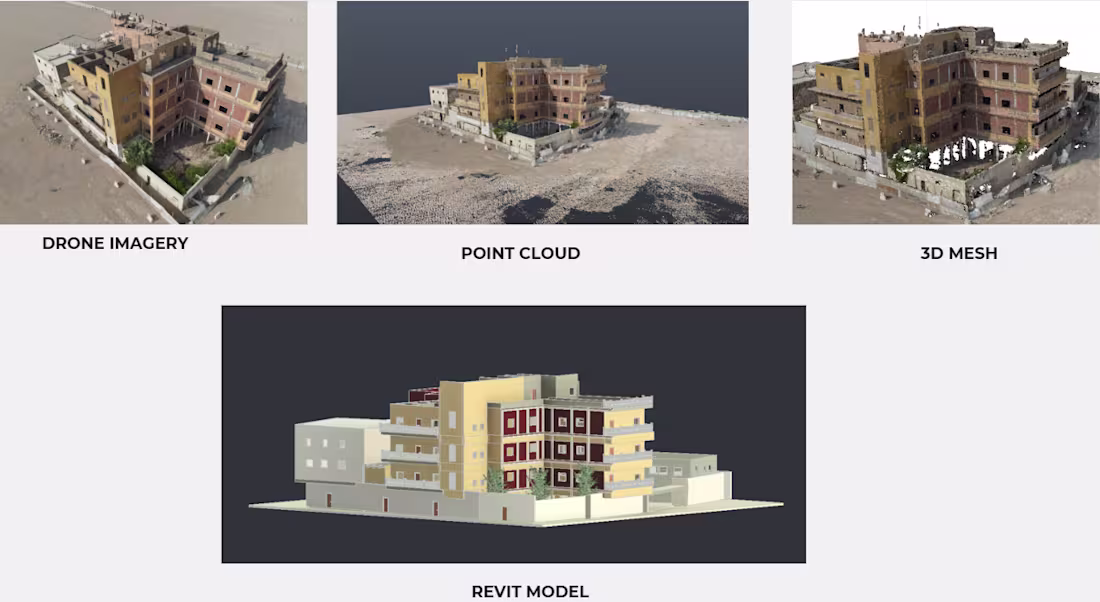
This heritage preservation project involved integrating laser scan data and 3D mesh models to create an accurate digital twin of a historic residence in Jeddah. I processed and aligned the datasets in Autodesk ReCap Pro and Agisoft Metashape, then developed a high-fidelity BIM model in Revit for documentation, analysis, and long-term conservation purposes.
I later built an interactive 3D web viewer to make the documentation publicly accessible. The experience opens with a Mapbox GL JS satellite landing page showing the exact site boundary and a cinematic fly-in before transitioning into the 3D viewer. Inside, a 3.9 million point laser scan is combined with the Revit BIM overlay, powered by Three.js. To optimize performance, I developed a custom binary format that merges 360 Potree files into one, reducing HTTP requests from 360 to 1. The viewer includes colour modes, point size control, and fullscreen support, deployed on Vercel as a zero-backend static app.
1
37