Go to sleep, may your sweet dreams come true...
Data Scientist, Python, ML Engineer & AI Developer
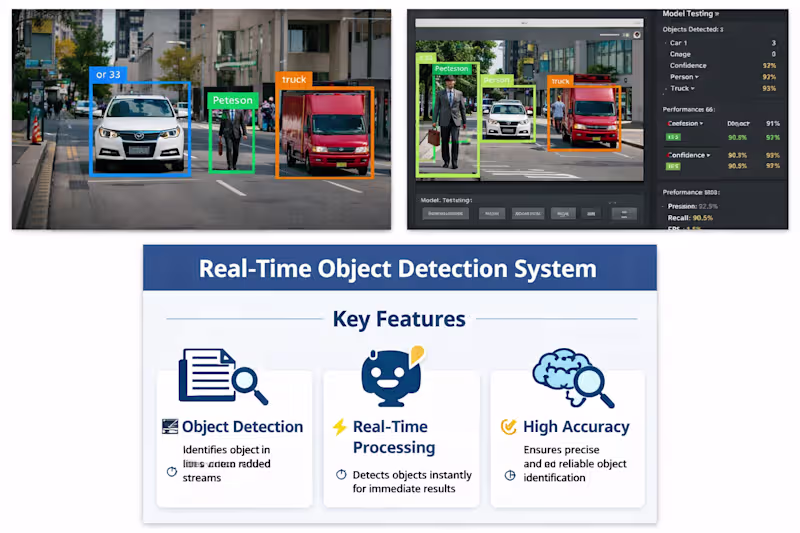
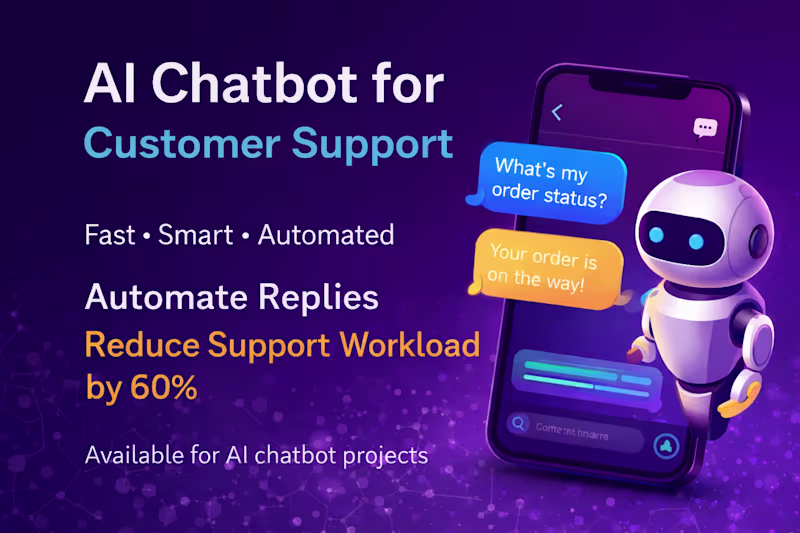
AI Chatbot Developer | Data Scientist | ML Engineer


View more →
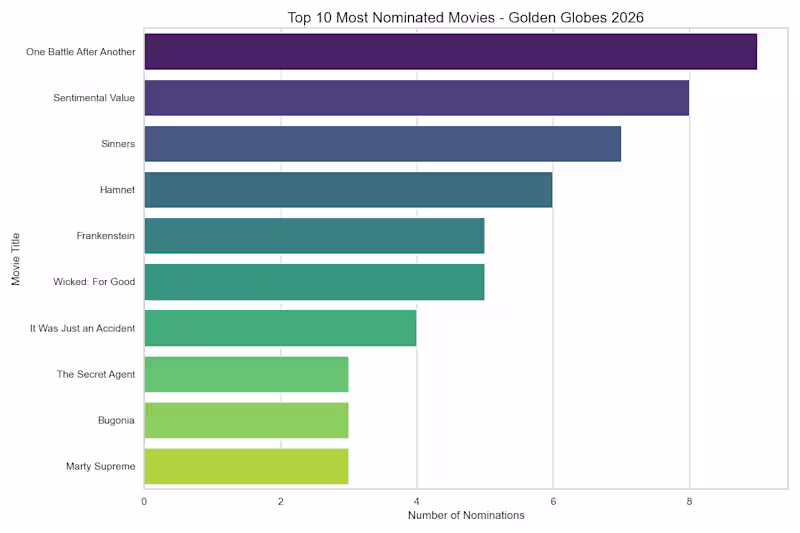
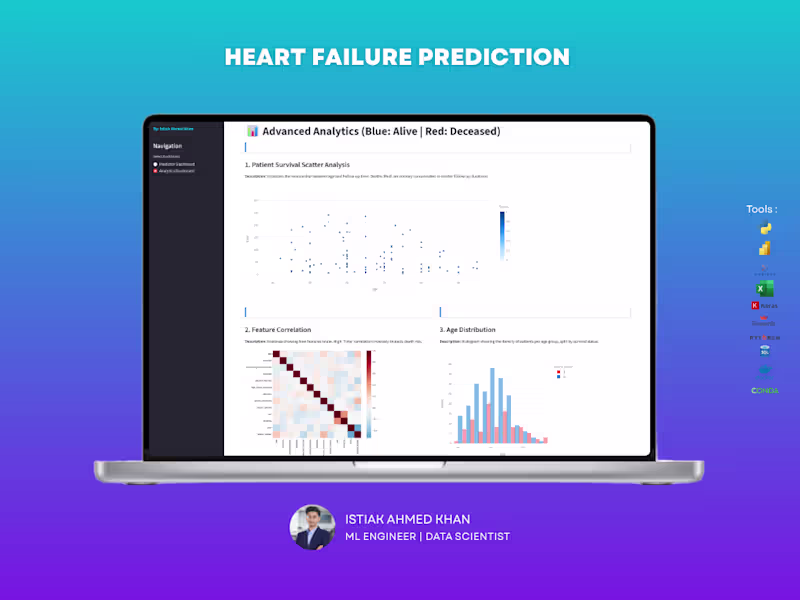
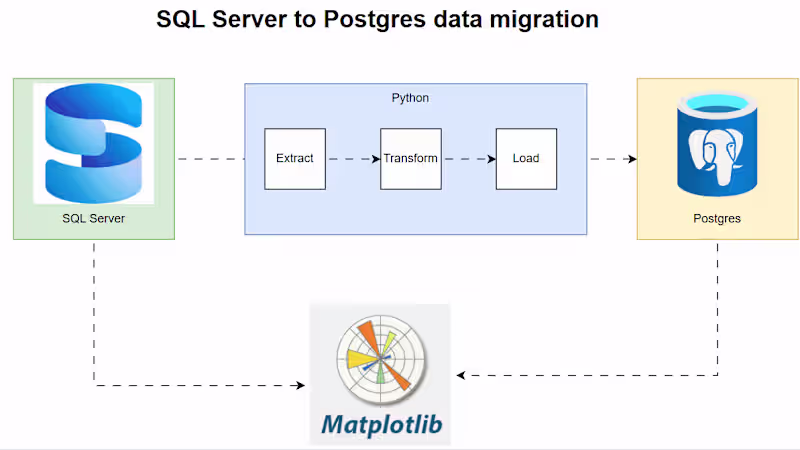
Expert Data Visualization with Tableau & Matplotlib
Expert Data Visualization with Tableau & Matplotlib

View more →
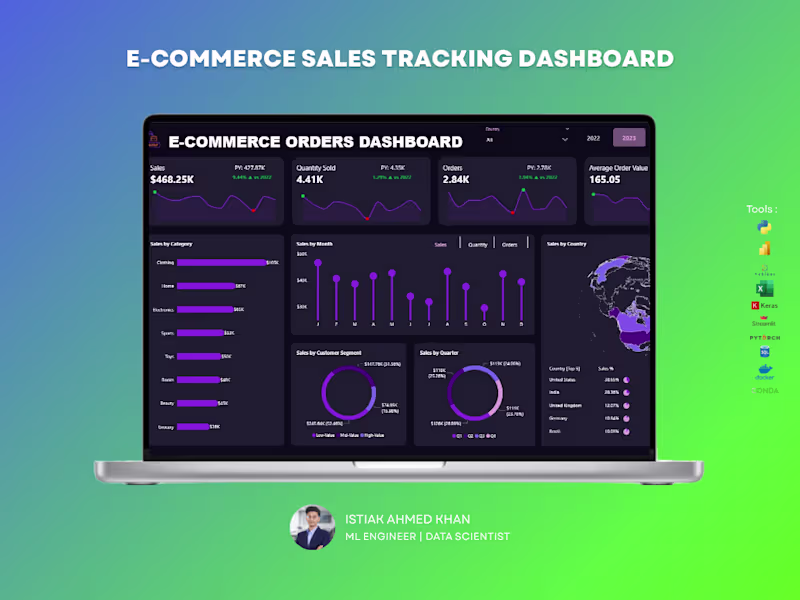
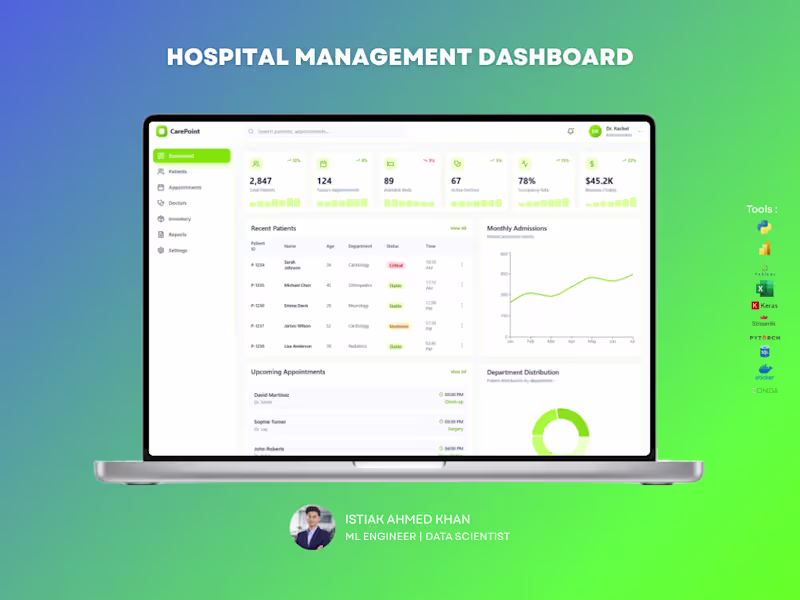
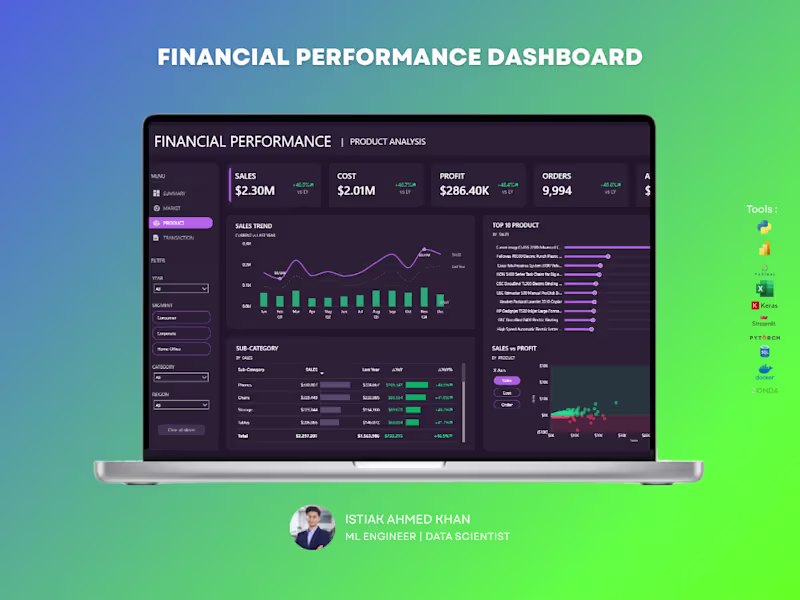
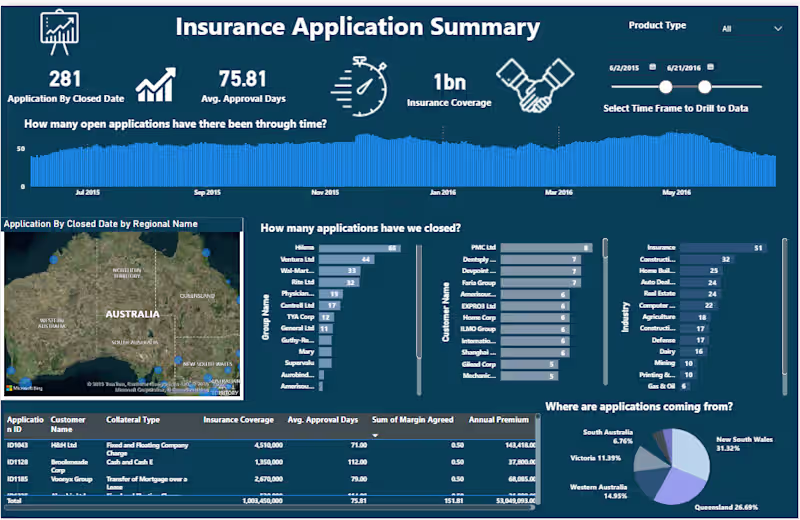
Power BI Data Analyst + ML AI Automation Expert
- 5.0
- Rating
- 105
- Followers
Power BI Data Analyst + ML AI Automation Expert
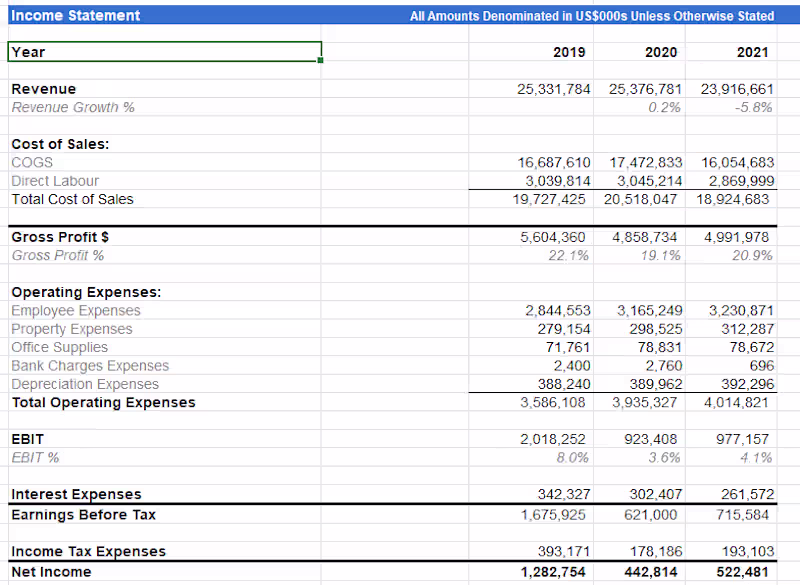
Professional Accountant | Bookkeeping, Financial Reporting
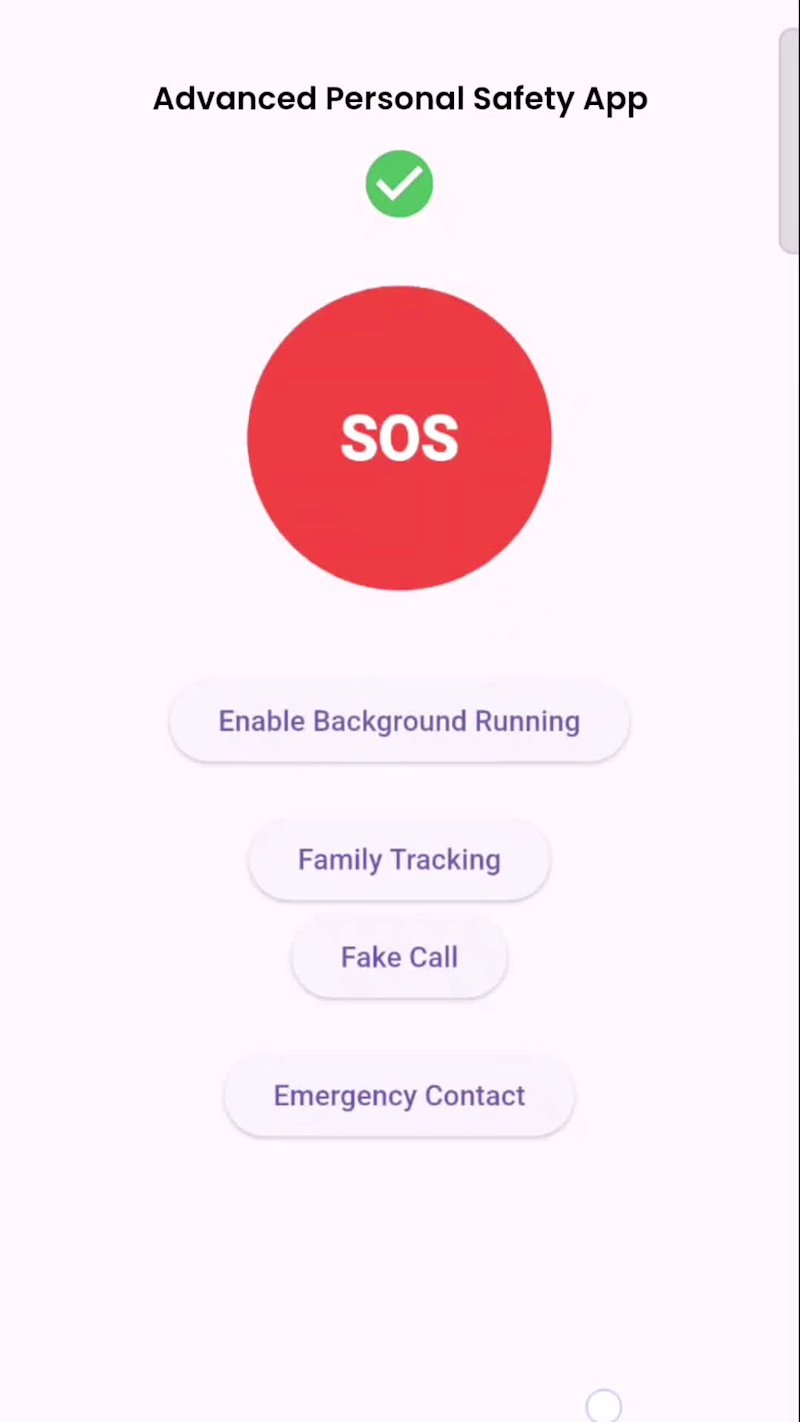
AI Automation & Chatbot Developer | Flutter Developer

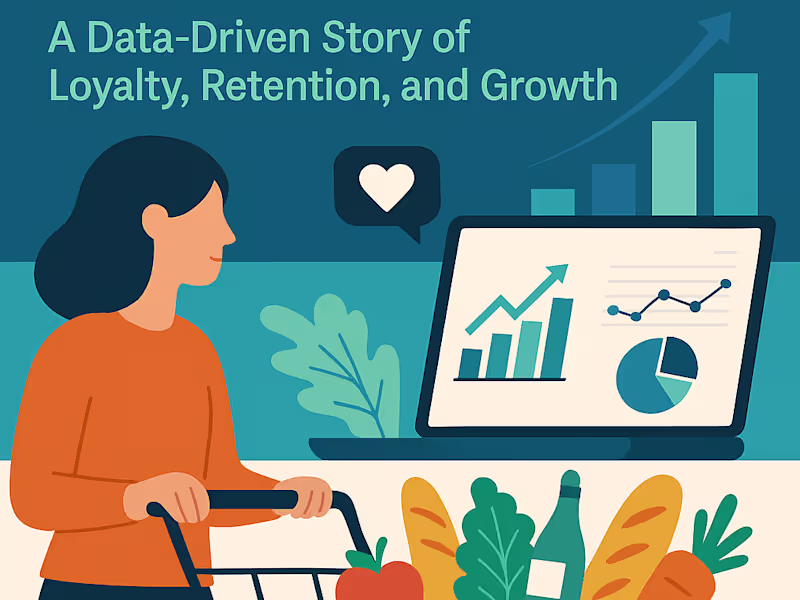
Data Analyst turning Data insights into business impact.
- 5.0
- Rating
- 2
- Followers
Data Analyst turning Data insights into business impact.