Freelancers using Google BigQuery
Sign Up
Post a job
Sign Up
Log In
Filters
1
Projects
People
Manuel Navarro
pro
Santa Cruz de Tenerife, Spain
AI Video Creator | Automations Engineer | AI SaaS Developer
$50k+
Earned
14x
Hired
5.0
Rating
408
Followers
Top
Expert
Follow
Message
AI Video Creator | Automations Engineer | AI SaaS Developer
4
BigQuery Database Creation and Automation
4
152
15
AI-Driven Social Media Content Pipeline
15
451
12
SaaS Development Replit
12
688
7
Automated n8n Workflow for Data Management
7
383
Google BigQuery
(1)
Follow
Message
Toolshed (Data, Automation, AI Agents, Buildship, Framer)
max
Lahore, Pakistan
Data, Automation, AI Agents, Buildship, Framer, Bubble
$100k+
Earned
7x
Hired
5.0
Rating
72
Followers
Top
expert
+1
Follow
Message
Data, Automation, AI Agents, Buildship, Framer, Bubble
6
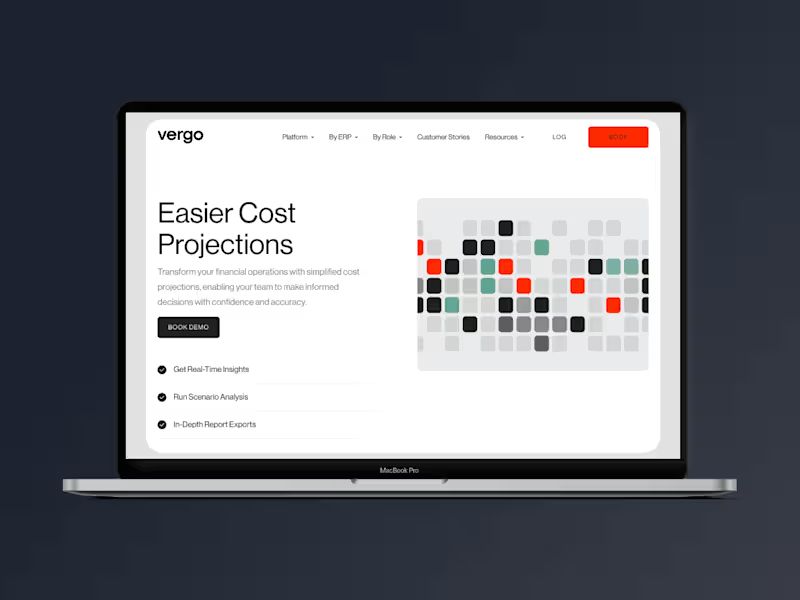
Construction FP&A & Revenue AI Platform
6
312
1
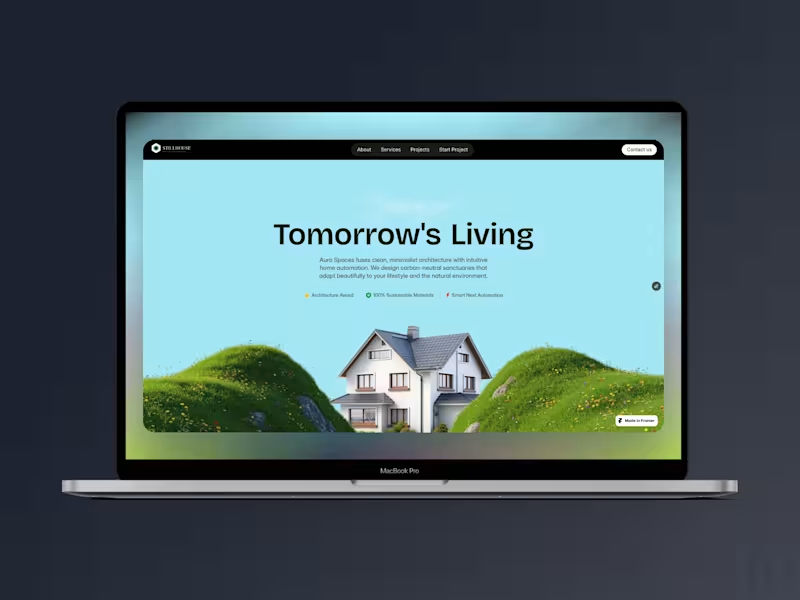
Luxury Framer Architecture Portfolio
1
24
0
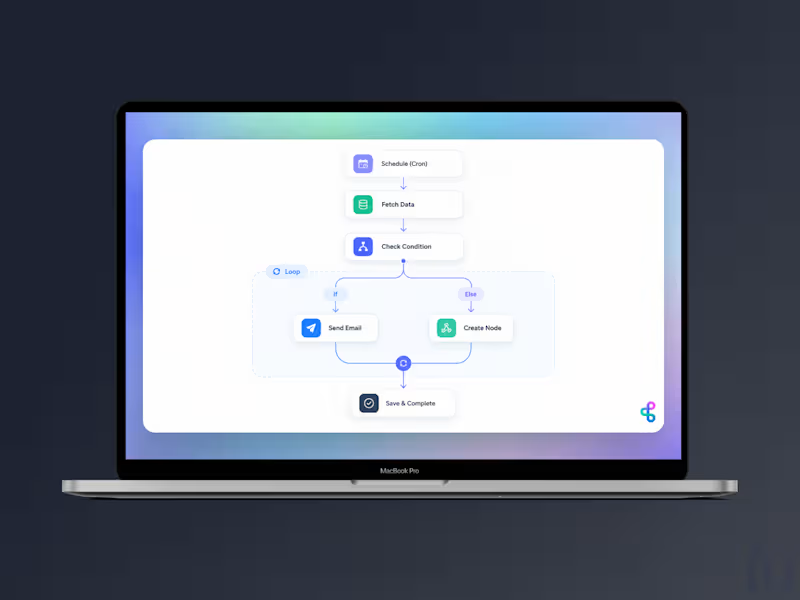
Automated Weather Monitoring with BuildShip & Supabase
0
2
0
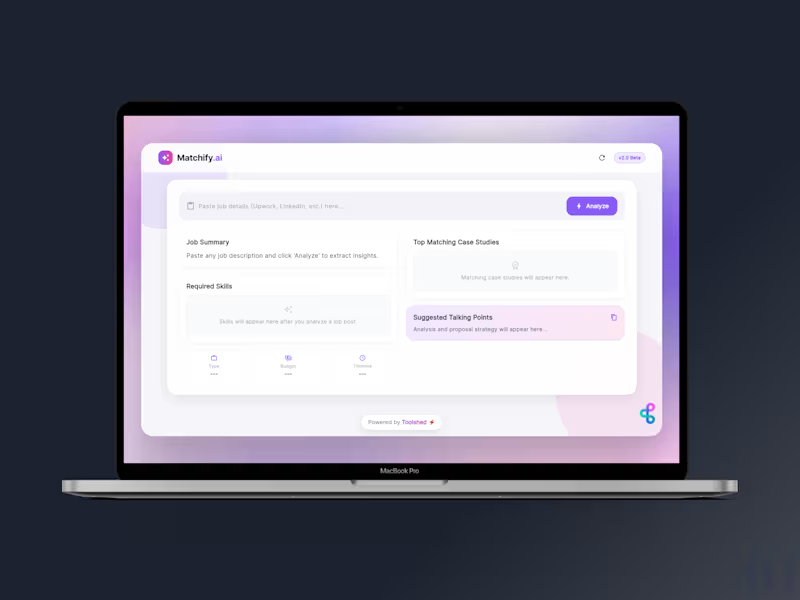
BuildShip AI Automation & Internal Tool for Job Analysis
0
3
Google BigQuery
(1)
Follow
Message
Erin Riggers
pro
Houston, USA
Data-Driven Solutions with Developer Precision
$10k+
Earned
4x
Hired
5.0
Rating
81
Followers
Follow
Message
Data-Driven Solutions with Developer Precision
$5.4K+ earned
3
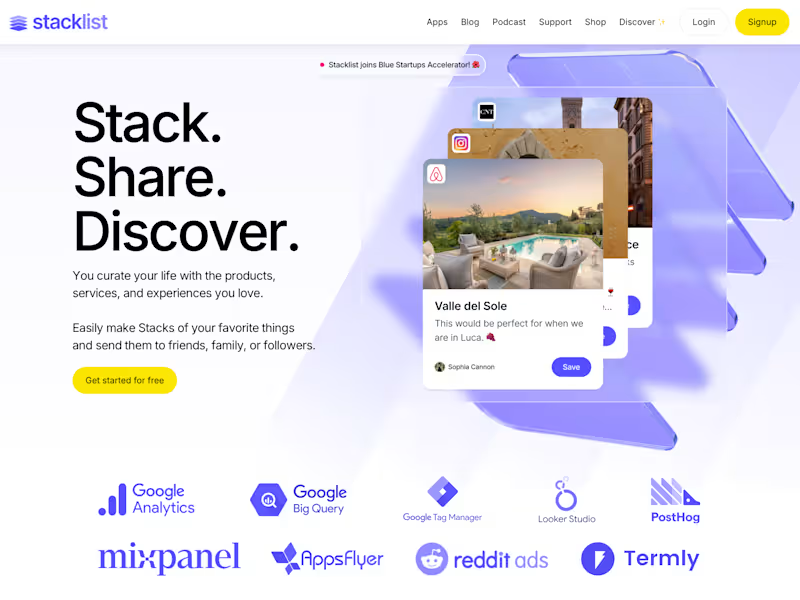
Marketing Stack Audit and Optimization for Stacklist
3
159
2
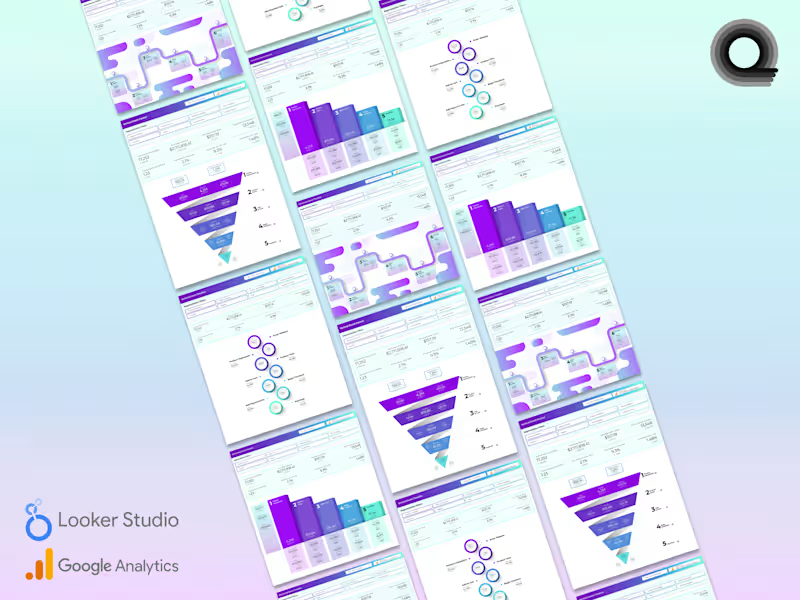
I posted another couple of new Looker Studio dashboards in my Contra shop today and thought I would share some related eye candy with ya'll. This is a bundle of four funnel and timeline data visualizations / infographics that I created specifically for Google Analytics e-commerce events. I was inspired to create this after having stumbled upon a slough of similar GA4 ecommerce-related dashboards that were woefully visually unappealing. Creating more beauty in the world around me is one of my prime movers. https://contra.com/products/mYxjErTV-ga4-ecommerce-funnel-visualization-pack
2
414
4
OneTrust Consent Management Consulting
4
45
2
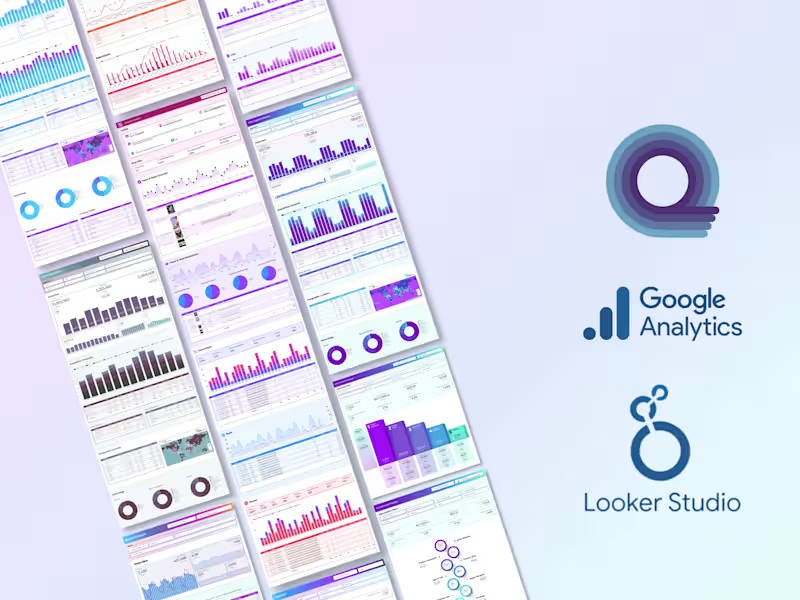
Google Analytics Looker Studio Dashboards
2
112
Google BigQuery
(1)
Follow
Message
Tayyab Ali
Pakistan
AI System Architect | Database Expert | Data Analyst
$25k+
Earned
1x
Hired
5.0
Rating
78
Followers
Follow
Message
AI System Architect | Database Expert | Data Analyst
1
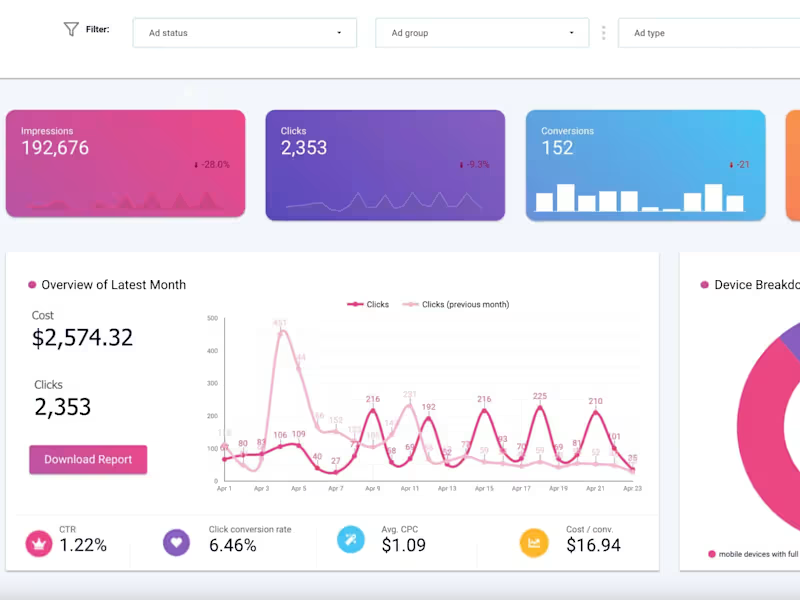
BI Dashboard | Google Analytics | Google Data Studio
1
127
2
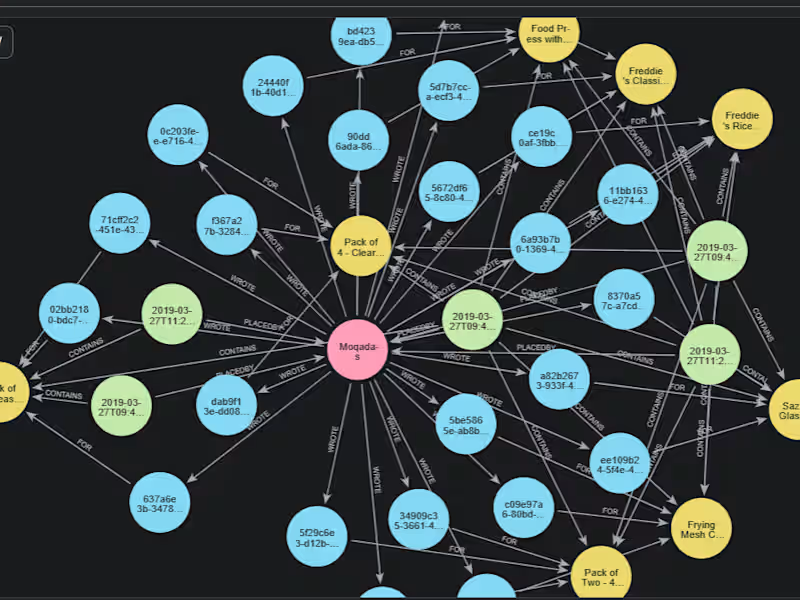
To get the real benefit of RAG/CAG systems for any business is only possible by the interconnectivity of data that can be developed in Graph Databases
2
703
1
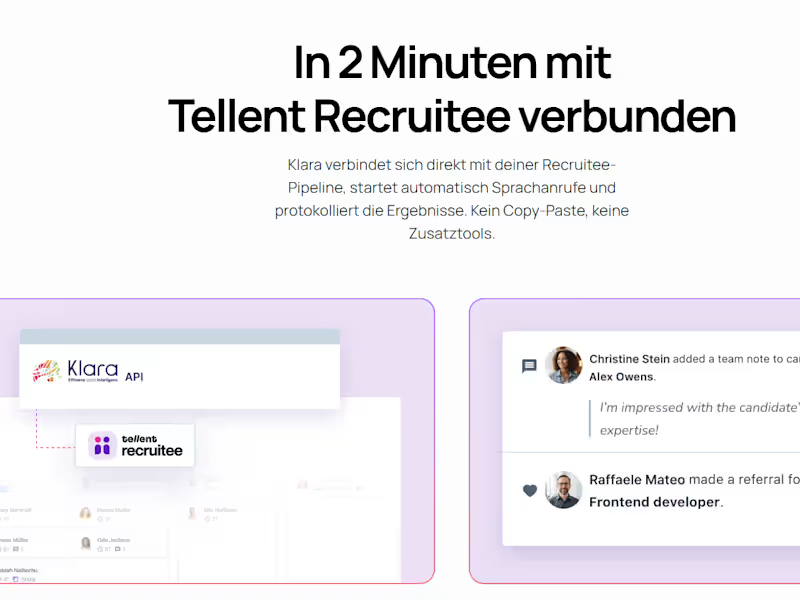
Klara AI - HR AI Voice calling agents in Germany
1
23
3
Graph & Vector Database Architectire Development
3
111
Google BigQuery
(1)
Follow
Message
Denish Kukadiya
India
Analytics Specialist and Data Visualizer
$1k+
Earned
3x
Hired
5.0
Rating
40
Followers
Follow
Message
Analytics Specialist and Data Visualizer

3
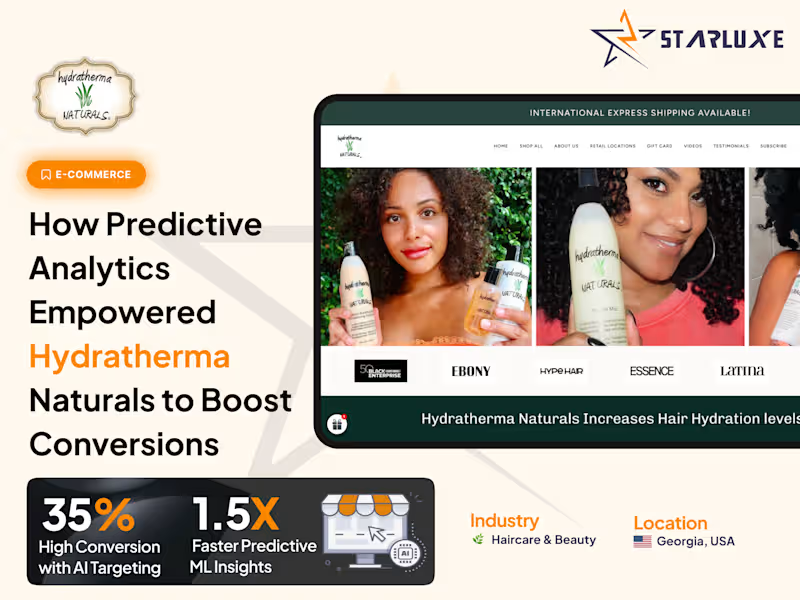
AI-Powered Conversion Optimization with iBQML for Hydratherma
3
30
2
Google Analytics Enhance Data Collection and Reporting
2
30
0
Data Analytics | MARTECH Expert
0
73
1
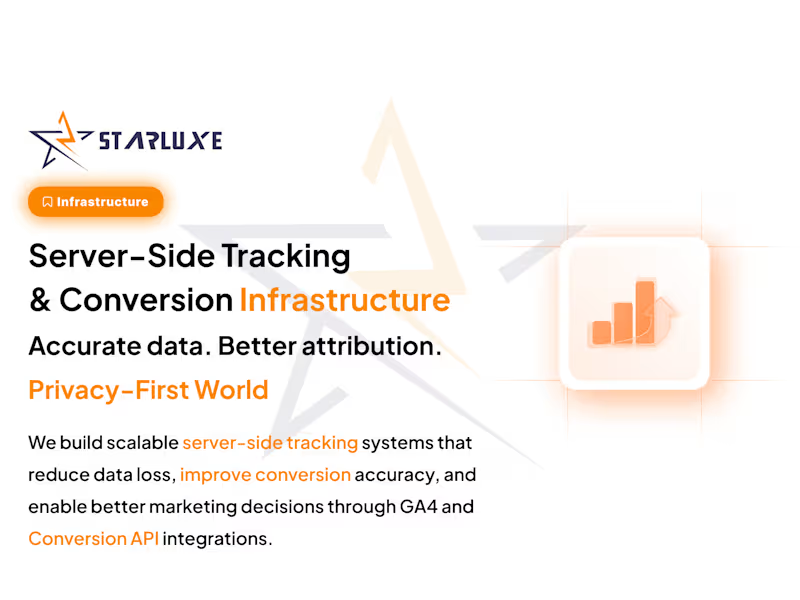
Server-Side Tracking Implementation for Enhanced Analytics
1
14
Google BigQuery
(3)
Follow
Message
Taziem Uddin
pro
Lahore, Pakistan
I install done-for-you analytics in high-ticket businesses.
$10k+
Earned
3x
Hired
4
Followers
Follow
Message
I install done-for-you analytics in high-ticket businesses.
1
No More Mondays: Built From Scratch, One Warehouse
1
42
1
No More Mondays: $1M+ Traced, Deal by Deal
1
7
2
No More Mondays: Ask Your Data, Get Answers in Seconds
2
47
1
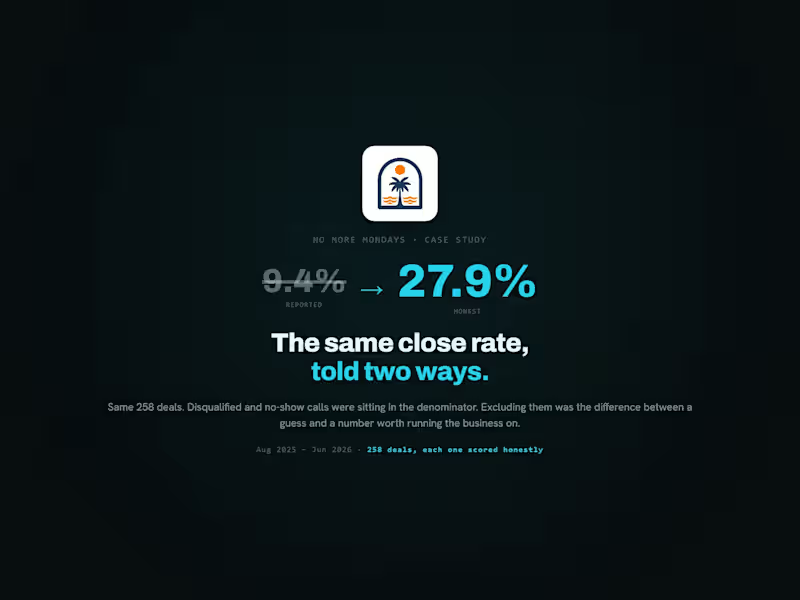
No More Mondays: The Same Close Rate, Told Two Ways
1
50
Google BigQuery
(2)
Follow
Message
Prem Patel
pro
India
Make.com Level 5 & Zapier Expert: AI and Ops Automation
10
Followers
Follow
Message
Make.com Level 5 & Zapier Expert: AI and Ops Automation
4
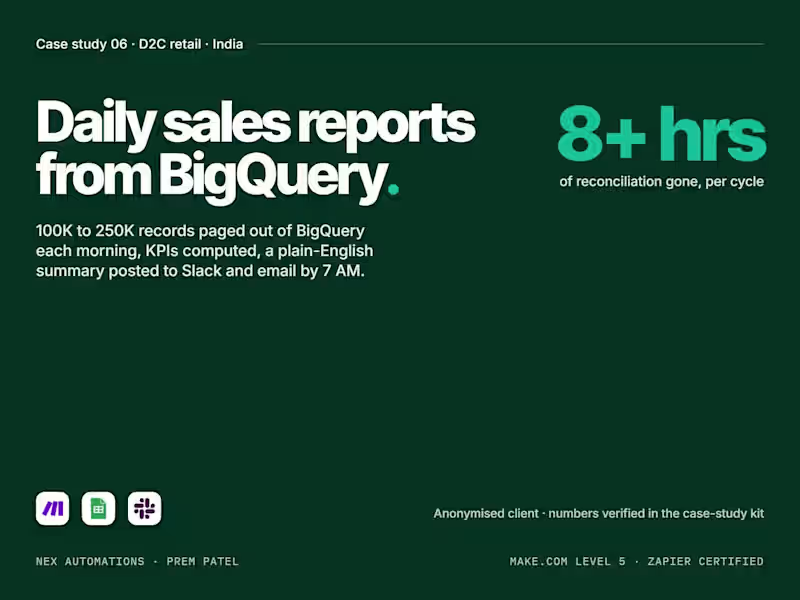
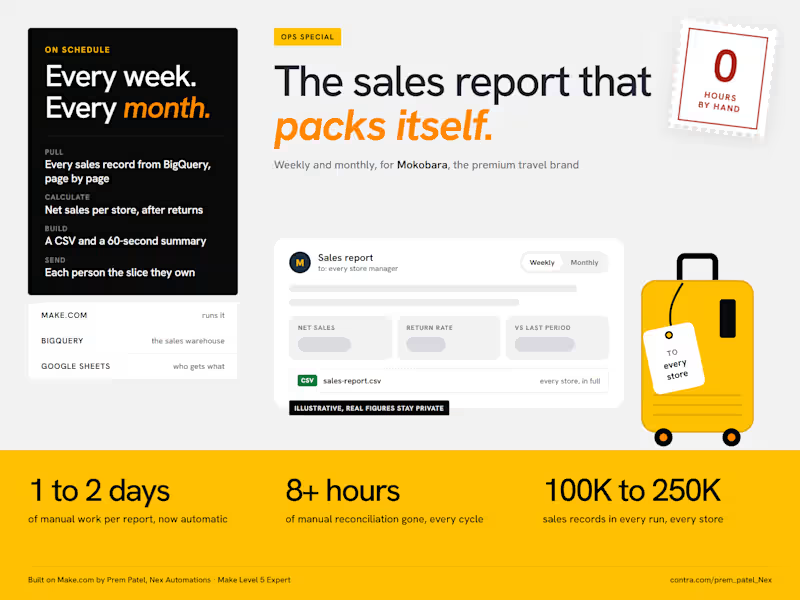
Does someone on your team lose a day or two building the sales report every week or month? That was the starting point at Mokobara, the premium travel brand. Pulling sales across all their stores, checking returns, reconciling the numbers and emailing each manager took 1 to 2 days every cycle, with 8+ hours of that spent just reconciling. I built them an automation on Make.com (http://Make.com) a few months ago. It has run on its own ever since, weekly and monthly: Make pulls every sales record from BigQuery, 100K to 250K per cycle. That is too many for one request, so it reads them page by page and stitches them back together. It calculates the numbers the team actually uses: net sales per store after returns and discounts, return rates and the change against the last period. It builds a CSV with the full breakdown and a short email summary you can read in 60 seconds. It reads a Google Sheet of store representatives and emails every one of them the report for their own store. The result: the reporting problem is gone. The report went from 1 to 2 days of manual work to fully automatic, and the 8+ hours of reconciliation dropped to zero. Two things I would do the same way again: Calculate "net sales" in the automation, not in the warehouse. The business rule for what counts as a net sale is not what the raw data stores. Send people their slice, not the whole report. One report for everyone gets skimmed by everyone. The figures in the image are placeholders, the real ones stay with the client. What report is your team still building by hand? Tell me where the data lives and I will tell you how I would automate it.
4
468
1
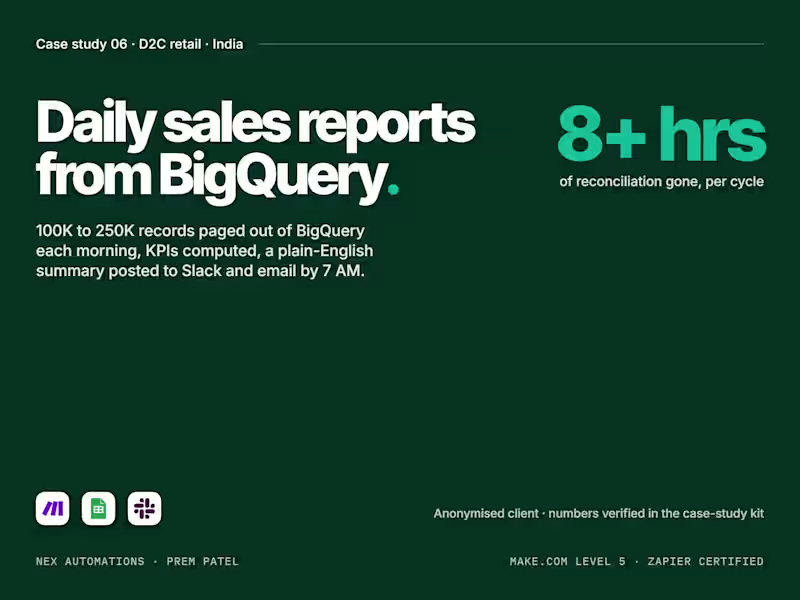
How do you automate a daily sales report from BigQuery to Slack with Make.com, when the data is 250,000 rows and the reader is not an analyst? Six decisions make or break it. A direct-to-consumer brand's daily sales report took one to two days to compile, which meant Monday's numbers arrived on Wednesday. A 7 AM Make.com scenario now pages the data out of BigQuery, computes the KPIs and posts a plain-English summary to Slack and email before anyone opens a laptop. The six decisions: 1. Page, do not pull. A day can be up to 250,000 rows. The scenario pages through BigQuery in chunks and aggregates as it goes, so no single step holds the whole table. 2. Compute the KPIs in the scenario, not in the prompt. Revenue, orders, average order value, top products and day-on-day change are arithmetic. The model only writes the sentences. 3. Give the model numbers, never the rows. A short structured summary goes to OpenAI with a fixed template; the output is two paragraphs a founder reads in thirty seconds. 4. Check before you post. If a KPI is null, if the row count is far below the trailing average, if a query failed, the scenario alerts the owner instead of posting a confident wrong report. 5. Post where people already look. Slack channel at 7 AM plus an email copy for the people not in Slack. No dashboard to remember to open. 6. Keep a paper trail. Every run logs the query window, row count, KPIs and the text it posted, so a number can be traced back a month later. The diagram shows the run: schedule, paged query, KPI step, summary, checks, Slack and email. The full case study is on my profile. The same scenario shape works with Shopify, Stripe, a CRM or a Sheet as the source. Prem Patel, Nex Automations. Make.com Level 5 certified, official Make partner, Zapier Certified Expert.
1
292
1
BigQuery to Slack daily sales reports on Make.com, D2C brand
1
7
4
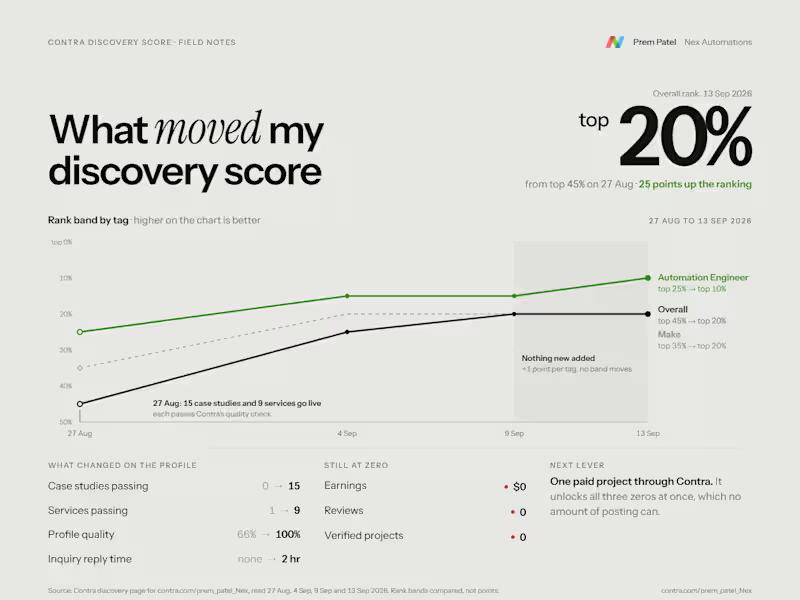
Is your Contra discovery score stuck? Mine went from top 45% to top 20% in 13 days, and posting more is not what moved it. And i need real Project On Contra😅 I log my score on every tag with a small script that reads all 48 options on the discovery page, so this is what actually changed between 27 August and 9 September 2026, and what did not. What moved it: Case studies. From 0 passing Contra's quality check to 15. Contra's checklist is short: a custom cover, a clear descriptive title, an engaging description, in-depth content and real media. My first two projects failed it, one on the description and one on the media. Services. From 1 passing service to 9, each with its own cover, a descriptive title, a rate and a real summary. Every tag a service carries gets the lift, so tag the tools you actually used. Profile quality, 66% to 100% after the profile rewrite. Replying to the first inquiry quickly. Response time was blank until then. It now reads 2 hours. The result: Overall top 45% to top 20%. Automation Engineer top 25% to top 10%. Make top 35% to top 20%. What did not move it: the four days after. From 9 to 13 September every tag gained exactly 1 point. Nothing new on the profile, nothing moves. And the three biggest levers on my board are still at zero: earnings, reviews and verified projects. All three come from the same move, one paid project routed through Contra, so that is where my next week goes. One thing if you compare yourself with others: Contra's point scale changed between my runs, so compare your rank band (top X%) rather than the raw points. What moved yours? If yours is stuck, reply with your score and the tag, and I will tell you which lever I would pull first.
2
4
212
Google BigQuery
(3)
Follow
Message
Sam Fairweather
Sydney NSW 2000, Australia
I build fully automated, zero cost reporting platforms.
10
Followers
Follow
Message
I build fully automated, zero cost reporting platforms.

8
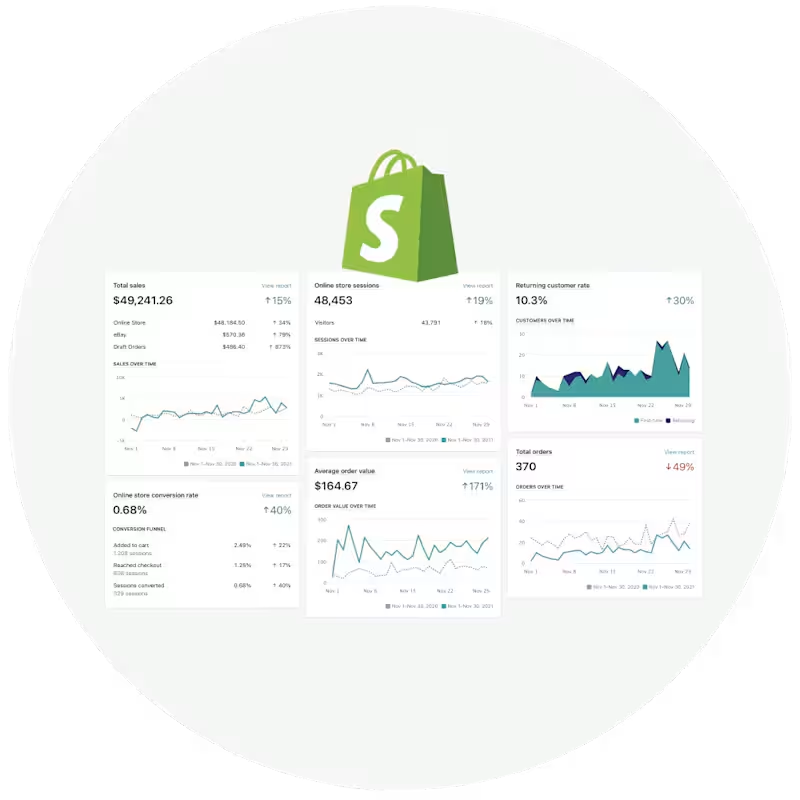
Shopify Performance Dashboard Development
8
318
0
Custom Automated Reporting Platform for HPA Group
0
10
0
Custom Automated Reporting Platform for Metropolis
0
17
View more →
Google BigQuery
(3)
Follow
Message
Explore people