Statistics Projects
Statistics Projects
Sign Up
Post a job
Sign Up
Log In
Filters
1
Projects
People
Message
2
Renate Oniuna
Metabolite Changes in Dialysis Effluent by Modality
2
21
Message
0
Nicholas Canfield
Retool App For Medical Insurance Billing
0
16
Message
1
Leonardo Gonzalez
Case Study: Pricing Strategy for a New Premium Hair Serum
1
7
Message
0
Shekh Al Raihan
pro
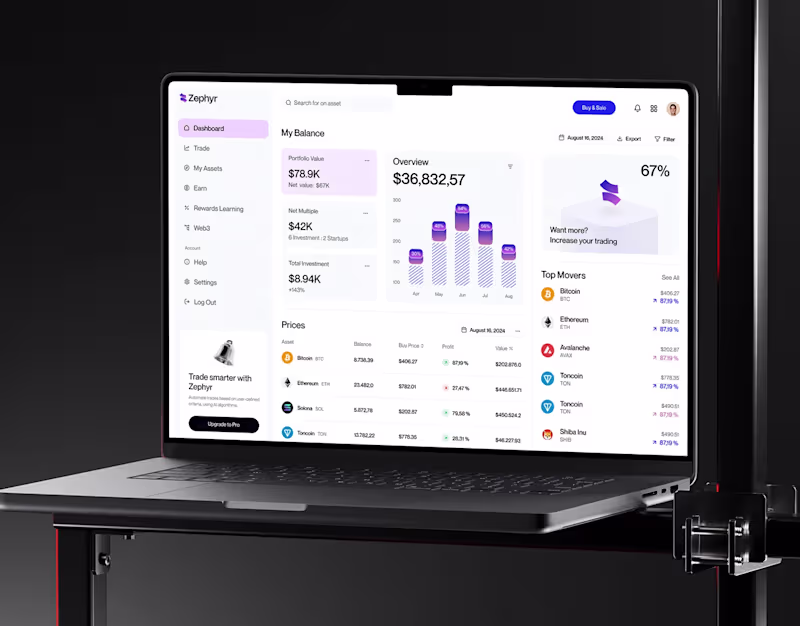
Zephyr | A B2B Web3 Payments Platform
0
0
Message
0
Mintesnot Mengesha
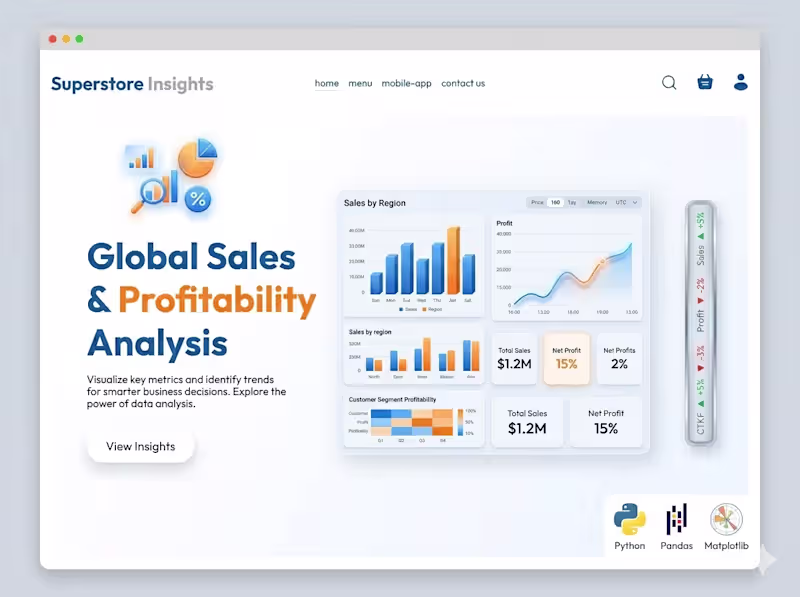
Global Superstore: Strategic Sales & Profitability Analysis I performed a comprehensive analysis of the Global Superstore dataset to uncover hidden trends in sales performance, customer behavior, and regional profitability. This project demonstrates my ability to transform raw data into actionable business intelligence using modern data science techniques. Key Technical Features: Data Wrangling: Performed extensive data cleaning and preprocessing using Pandas to handle missing values and inconsistent formatting. Exploratory Data Analysis (EDA): Conducted deep-dive analysis to identify top-performing product categories and high-growth geographic regions. Visual Intelligence: Created advanced visualizations using Matplotlib and Seaborn to represent complex sales trends and profit margins clearly. Business Impact: Developed a data-driven model to identify the key drivers of customer churn and profitability bottlenecks.
0
28
Message
0
Juan Carlos Hdez Vizcarra
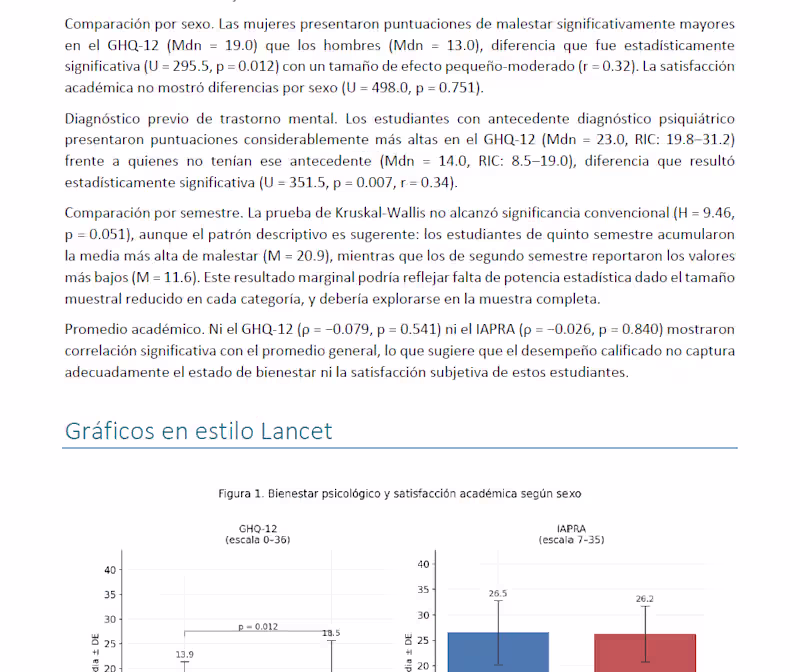
🧠 Research Data Analysis Project This project focused on the statistical evaluation of psychological well-being and academic satisfaction using survey-based research data. The workflow included database preparation, data cleaning, coding, descriptive statistics, and inferential analysis to identify patterns and relationships within the collected information. Findings were transformed into clear visualizations and research-ready outputs to support interpretation and decision-making.
0
5
Message
0
Muzamil Tariq
Machine Learning Model for Concrete Strength Prediction
0
3
Message
0
Shayne Cuffy
Giving a Voice to Breast Cancer Patients at Work
0
8
Message
0
Anthony Remichris
Analyzing COVID-19 World Data with SQL
0
21
Message
1
Olha Arkusha
pro
American Football Stats Tracking Mobile App
1
4
Message
0
Rajajayaruban T
Virtual Textiles Shop
0
25
Message
0
Ahmad Ali
SEO key words Assignments Dissertation
0
12
Message
0
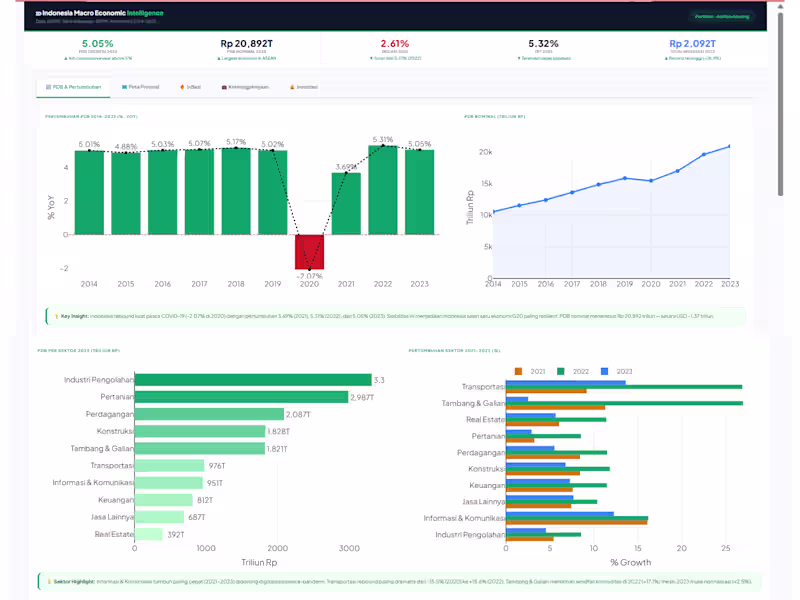
Arditya Apusing
Interactive macroeconomic dashboard built in R Shiny covering GDP growth trends, provincial inflation heatmaps, unemployment-investment correlation, and Gini coefficient analysis across Indonesia (2014–2023). Data sourced from BPS RI, Bank Indonesia, and BKPM. Built for policymakers and analysts who need fast, visual access to national economic indicators.
0
48
Message
0
Marshal Davis
: Supply Chain, Delay, Delivery, & Risk Example Plots
0
28
Message
2
shimaa gamal
Excited to share my project on Stitch with Google! The idea revolves around sustainability and eco-friendly habits: a system that allows users to exchange empty plastic bottles for cash. It's a smart way to encourage recycling and reward positive environmental impact. Check it outhttps://stitch.withgoogle.com/projects/14113705891978707100
1
2
110
Message
0
Kunal Khatri
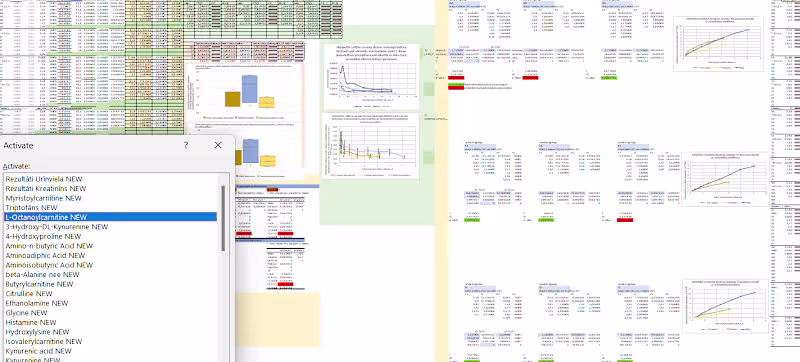
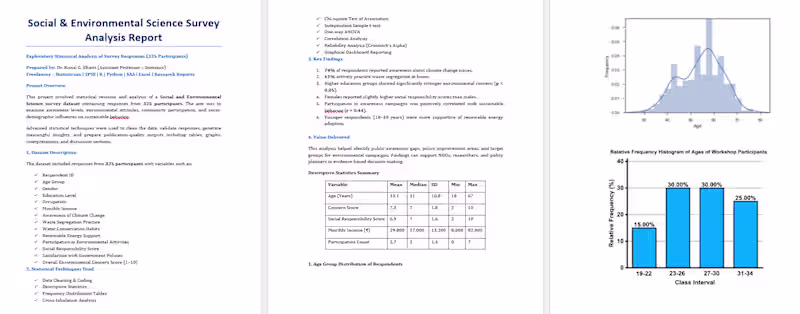
🧠 Title: Statistical Analysis of 325 Survey Responses for Research Study 📌 Problem: The client required a complete statistical analysis of survey data (325 respondents) to examine relationships between multiple factors such as organizational support, job involvement, and employee engagement. They needed: 1. Correct statistical test selection 2. Accurate analysis 3. Clear interpretation for research reporting ⚙️ Approach: I followed a structured analytical process: 1. Data cleaning and preprocessing 2. Reliability testing (Cronbach’s Alpha) 3. Descriptive statistics 4. Correlation analysis 5. Regression analysis 6. Hypothesis testing using SPSS 🛠 Tools Used: SPSS, Excel, R, Python 📊 Results 1. Identified significant relationships between key variables 2. Established impact of organizational support on engagement 3. Generated clear statistical outputs with interpretation 🎯 Outcome: The client successfully completed their research project with strong statistical backing and well-structured results for their report/dissertation. 💡 Key Value Delivered 1. Accurate and reliable statistical analysis 2. Easy-to-understand interpretation 3. Research-ready outputs
0
16
Explore projects