
Digital Business Partner | Systems, Workflows & Web
Digital Business Partner | Systems, Workflows & Web


AI Agents & Automation for Small Business & Hospitality


I turn raw, messy business data into a reporting layer a decision-maker actually reads: a one-glance dashboard (spend by month/category, price movements), breakdowns by supplier and category, price-trend tracking, and a ledger where every figure reconciles (net + VAT = gross, totals tie back). Rebuilds into a multi-sheet Excel workbook. Works from any CSV, spreadsheet or accounting export.
1
120

A Telegram bot that turns any invoice or receipt photo into a verified Excel record: OCR extracts supplier, tax ID, dates, net/VAT/gross and line items; every document is arithmetic-checked (net + VAT = gross) and duplicates are caught. One command exports a multi-sheet workbook. Live 6 months: 484 documents, 135 suppliers, 75 mismatches auto-caught, zero manual entry.
0
98

Python automation: scrapers, bots, dashboards, APIs
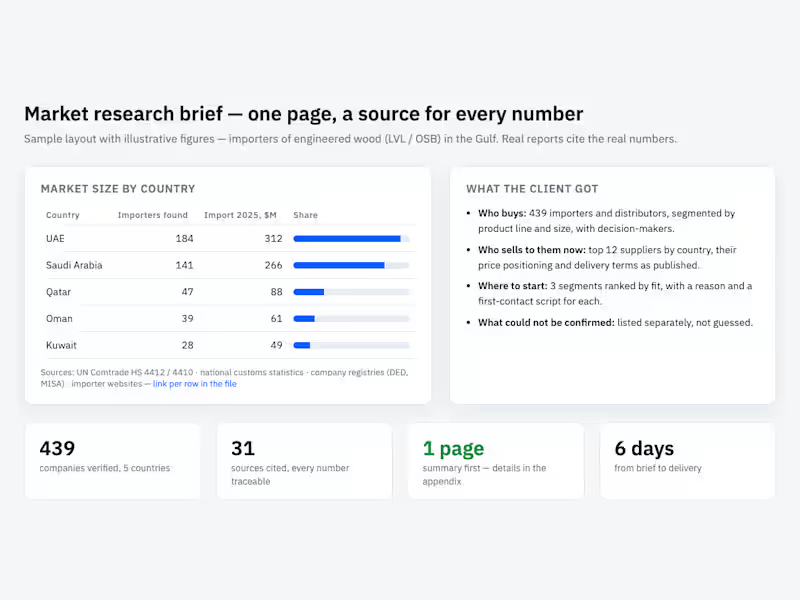
Market research brief — one page first, a source for every number. Sample layout with illustrative figures: importers of engineered wood in the Gulf, market size by country, who buys, who sells to them now, where to start.
1
136

Software Engineer - Api, Automation, Scripts
Software Engineer - Api, Automation, Scripts


Data Analytics Expert
Data Analytics Expert


Analyzed revenue lifecycle using cohort tables and MMR tracking. Visualized user payment behavior, retention shifts, and total revenue dynamics for data-driven growth.
0
60


Financial Analyst
Financial Analyst


