Freelancers using Microsoft Power BI in Santa Cruz de Tenerife
Freelancers using Microsoft Power BI in Santa Cruz de Tenerife
Sign Up
Post a job
Sign Up
Log In
Filters
2
Projects
People
Results that are similar to your search
Similar results
Message
3
Andreas Watts
Sales and Marketing Analytics Implementation for Verisure
3
317
Message
13
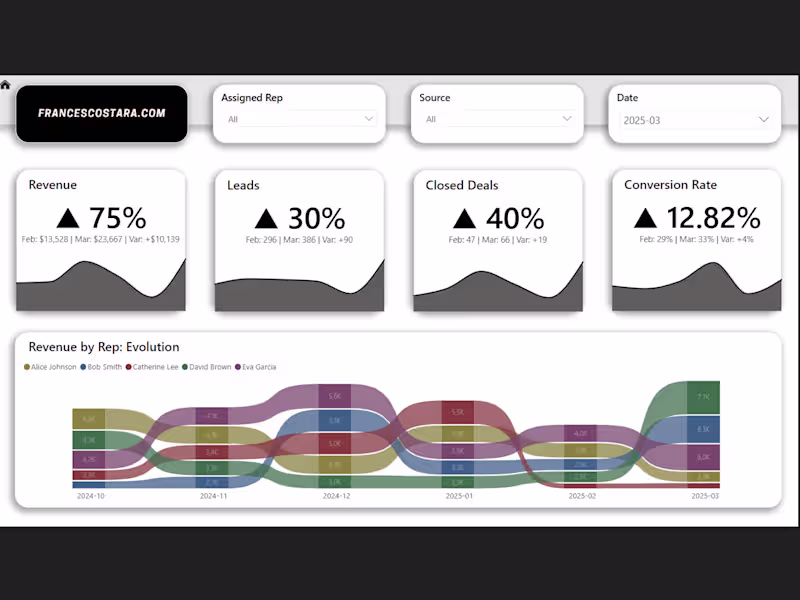
Francesco Stara
From Spreadsheet Chaos to Executive Clarity
13
659
Message
4
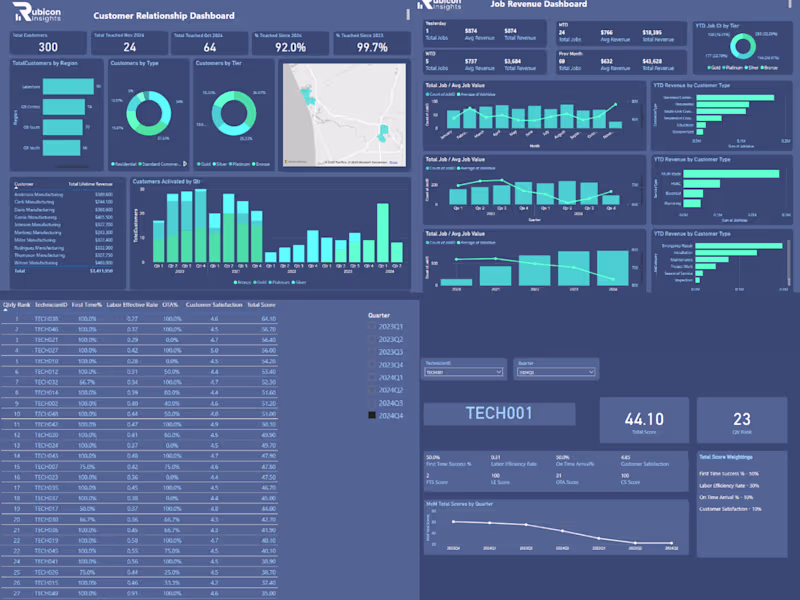
Rob Drlich
Modular Performance Reporting Dashboard Demo
4
121
Message
3
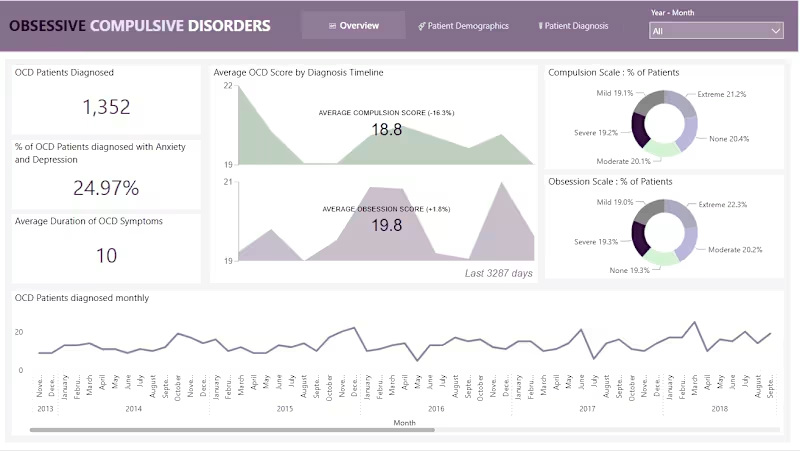
Rimsha Bashir
OCD Patient Analysis and Insights
3
183
Message
8
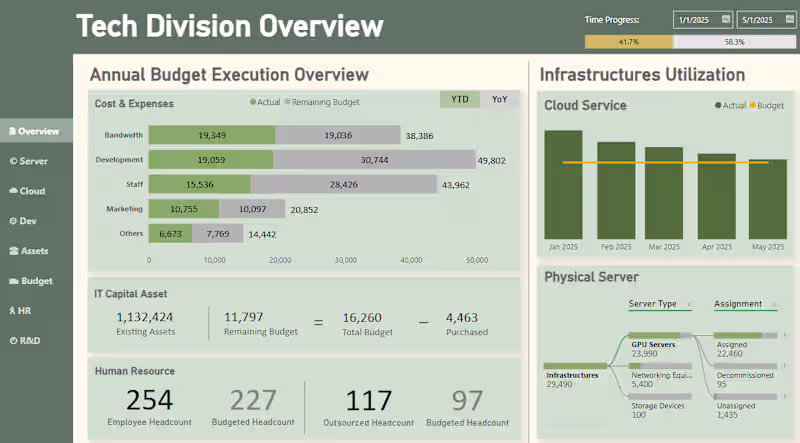
Andy Luo
Budget Execution Analysis PowerBI Visualization
8
222
Message
1
Aurelie Dussenne
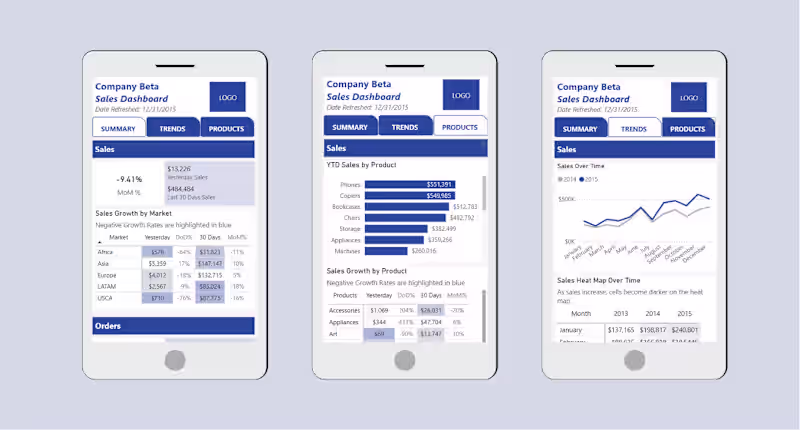
Wendy's - Power BI Mobile App
1
199
Message
2
Manideep racharla
Parking Lot Utilization Analysis Dashboard
2
35
Message
1
Uttam Kumaran
Retail Analytics in Power BI
1
60
Message
0
Bryan Julian
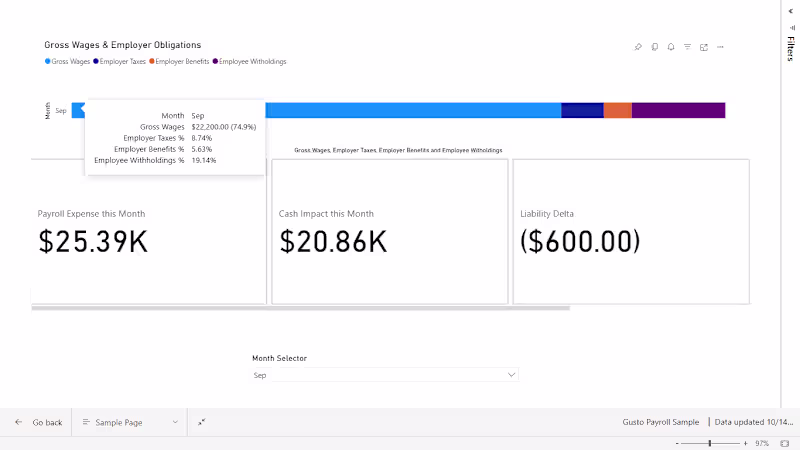
Gusto Payroll Health Dashboard
0
33
Message
2
Rebecca Jenek
pro
Diagnostic Cleanup & Reconciliation for High-Volume Accounts
2
30
Message
2
Darren Pierson
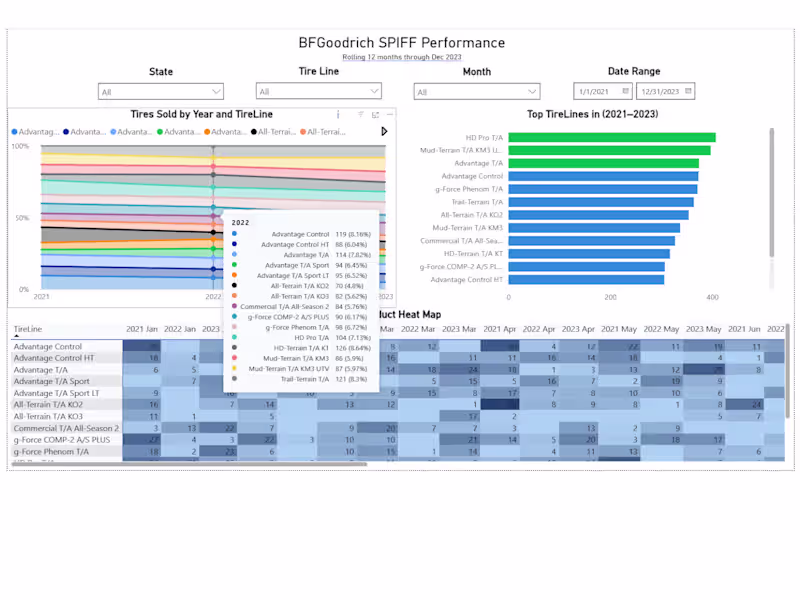
Power BI Dashboard for SPIFF Incentive Tracking
2
26
Message
2
Sidra choudry
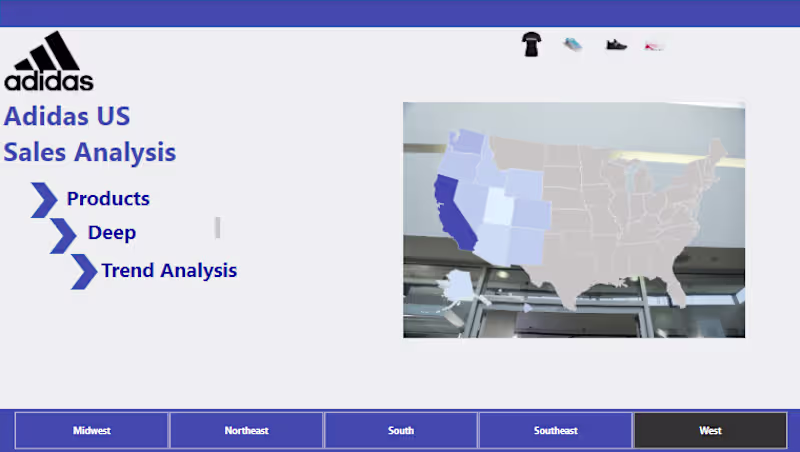
Adidas Sales Performance Dynamic Dashboard
2
16
Message
1
Adwoa Marfo
Human Resource Exploratory Data Analysis
1
10
Message
3
Ifigeneia Tsiflidou
Business Analysis & Visualization
3
54
Message
0
Kaedyn Cruickshank
Amazon Sales Data Analysis and Visualization
0
7
Message
0
Eric Sharpe
Automation KT
0
12
Explore projects