Results that are similar to your search
Similar results

AI Agents | LLMs, Computer Vision & Full-Stack Dev

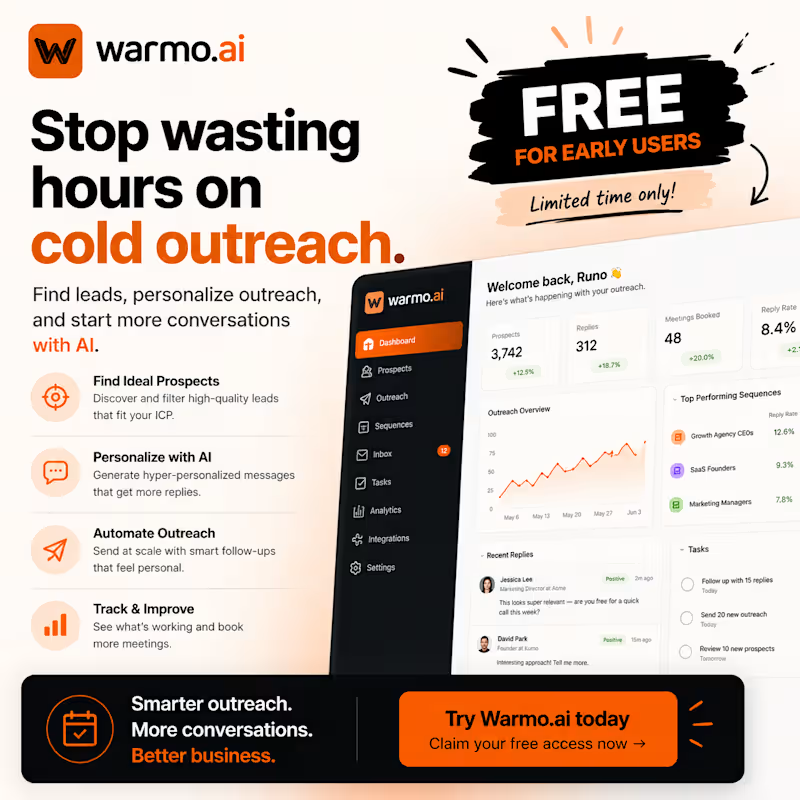
🚀 Most AI outreach tools stop at writing messages.
Warmo.ai (http://Warmo.ai) actually helps you find prospects, personalize outreach, and start meaningful conversations—all from one platform.
Whether you're a freelancer, agency owner, recruiter, or founder, it's built to save hours of manual work and help you book more meetings.
🔥 Best part? The first users can use it completely FREE.
If you've been waiting for an AI tool that actually helps you grow your business instead of just generating text, now's the time to try it.
👉 Check out Warmo.ai (http://Warmo.ai) and claim your free access while it's available.
#AI #Sales #LeadGeneration #Outreach #Freelancer #Agency #Startup #BusinessGrowth #Automation #Contra
7
245


Power BI Expert | Turning Raw Data into Actionable Insights
Power BI Expert | Turning Raw Data into Actionable Insights
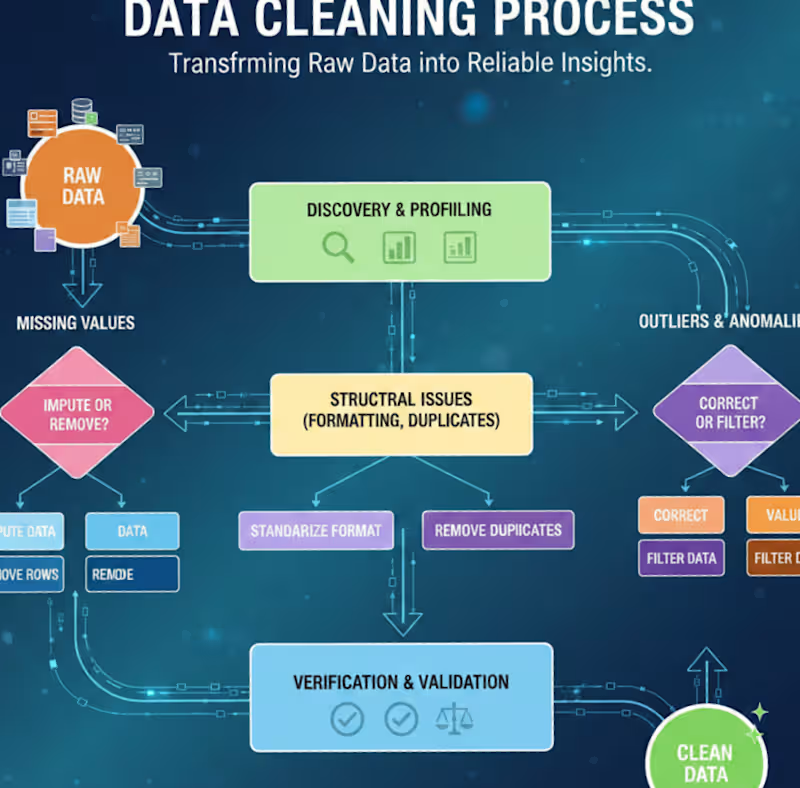
Data Analytics Project | BlinkIT Grocery Sales Analysis
Excited to share my latest Data Analytics project ,where I analyzed BlinkIT Grocery Sales Data and delivery data to uncover meaningful business insights 📈
📊 What I worked on:
Analyzed sales performance across product categories, outlet types, sizes, and locations
Identified top-performing item categories and customer preferences
Studied the impact of outlet size, establishment year, and visibility on sales
Converted raw data into actionable insights and business recommendations
💡 Key Insights:
Fruits & Vegetables, Snack Foods, and Frozen Foods drive maximum sales
FOR FULL PROJECT VIST GIT HUB –( https://lnkd.in/d34sdAPz
)
1
91
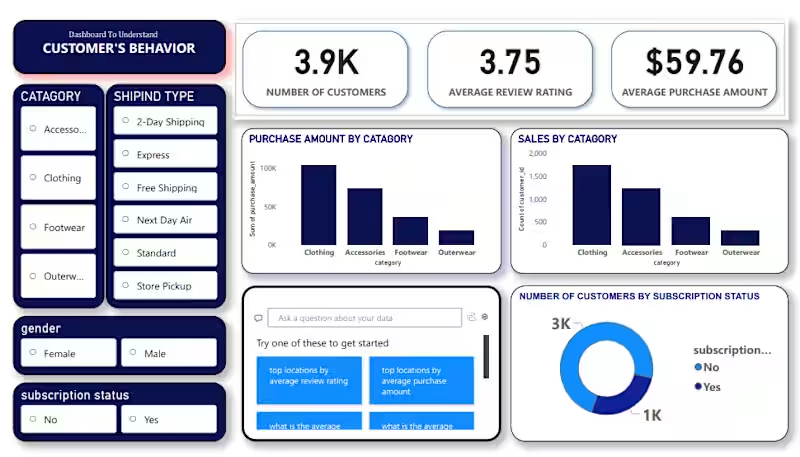
I’m excited to share my latest Data Analytics project where I analyzed Customer Shopping Behavior to uncover trends in sales, demographics, and purchasing habits.This project was a great exercise in building a complete data pipeline.
The Tech Stack:
Python (Pandas & NumPy): Used in Jupyter Notebooks for initial data exploration and statistical analysis.
PostgreSQL: Utilized for rigorous data cleaning, querying, and structuring the dataset for analysis.
Power BI: Built an interactive dashboard to visualize key metrics like seasonal trends, subscription impacts, and category performance.
Project Highlights:
✅ Data Cleaning: Leveraged PostgreSQL and Pandas to handle missing values and standardize categorical data.
1
2
124
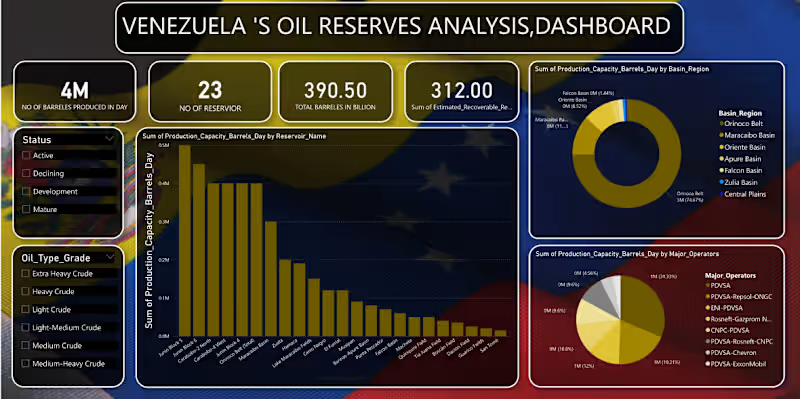
Venezuela’s Oil Reserves Analysis Dashboard 📊
I am excited to share my latest data analytics project focusing on the energy sector. Using a dataset covering 23 reservoirs, I designed a comprehensive dashboard to track production capacity and resource distribution in Venezuela.
Key Features: ✅ Real-time Metrics: Tracking the 390.50 Billion total barrels in reserve. ✅ Granular Analysis: Production capacity breakdown by reservoir name and oil grade (Extra Heavy to Light). ✅ Stakeholder Mapping: Visualizing the production sum by major operators.
Tools Used: [pandas(jupyter notebook)/mysql(for analysis and cleaning of data), Power BI / Excel(for building dashboard)]
I’d love to hear your thoughts or feedback on the dashboard design!
must visit my github for full project -( https://lnkd.in/dYKdZ8J2
)
0
106
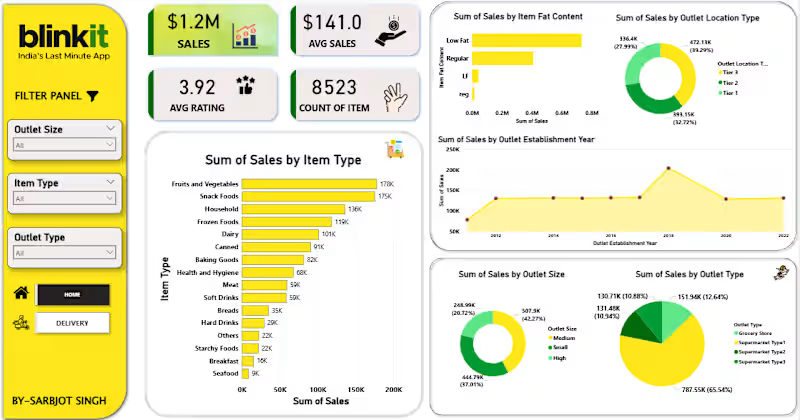
Data Analytics Project | BlinkIT Grocery Sales Analysis
Excited to share my latest Data Analytics project ,where I analyzed BlinkIT Grocery Sales Data and delivery data to uncover meaningful business insights 📈
📊 What I worked on:
Analyzed sales performance across product categories, outlet types, sizes, and locations
Identified top-performing item categories and customer preferences
Studied the impact of outlet size, establishment year, and visibility on sales
Converted raw data into actionable insights and business recommendations
💡 Key Insights:
Fruits & Vegetables, Snack Foods, and Frozen Foods drive maximum sales
Medium-sized outlets outperform others in overall revenue
FOR FULL PROJECT VIST GIT HUB –( https://lnkd.in/d34sdAPz
)
Feedback and suggestions are always welcome!
1
1
121

Data Analyst provided data driven decisions to stakeholders.


Detail-oriented Virtual Assistant and Data Entry Specialist
Detail-oriented Virtual Assistant and Data Entry Specialist


View more →

Full Stack Machine Learning Expert
Full Stack Machine Learning Expert


Data Scientist
Data Scientist


View more →

Data Analyst turning Data insights into business impact.
- 5.0
- Rating
- 3
- Followers
Data Analyst turning Data insights into business impact.




Research Intern @UIUC | AWS AI/ML Scholar '23 | @buildspace
- $1k+
- Earned
- 1x
- Hired
- 6
- Followers
Research Intern @UIUC | AWS AI/ML Scholar '23 | @buildspace


