Freelance Financial Analysts in Punjab
Sign Up
Post a job
Sign Up
Log In
Filters
2
Projects
People
Account Sphere
Sialkot, Pakistan
Helping Businesses Grow Through Accounting

Follow
Message
Helping Businesses Grow Through Accounting

1
Title: Automatic Bookkeeping Workbook — Single-Entry Journal to Full Financial Statements Description: A lightweight, fully automated Excel bookkeeping template built around one core idea: type a transaction once, and every downstream report updates itself. Unlike a full client engagement model, this is designed as a clean, reusable template — enter journal entries as balanced debit/credit lines on the one editable sheet, and the workbook handles the rest automatically: 1.One input sheet: Journal Entries is the only tab you type in — pick accounts from a dropdown, enter debit or credit amounts, and a built-in check column flags instantly if a line doesn't balance 2.Automated General Ledger: every account's full transaction history and running balance, generated without a single manual formula 3.Trial Balance with a live balance check 4.Financial statements: Income Statement, Balance Sheet (with automatic balance verification), and a direct-method Cash Flow Statement — all driven off a Cash Flow Category tag on cash transactions 5.Dashboard: auto-generated KPI snapshot (Total Assets, Liabilities, Equity, Net Income, Ending Cash) plus Revenue vs. Expenses and Operating Expense Mix charts 6.Color-coded design: blue for inputs, black for same-sheet formulas, green for cross-sheet links, grey for automated helper columns — so anyone opening the file immediately understands what's safe to edit Built to show that solid double-entry bookkeeping logic can be made genuinely foolproof for a non-accountant user — no VBA, no macros, just clean formula architecture. Skills demonstrated: Excel automation · Double-entry bookkeeping · Template design · Data validation · Financial statement preparation · Dashboard & chart design
1
132
1
Startup Financial Model — 3-Year Excel Model for Early-Stage Businesses A complete, investor-ready financial model built for newly established businesses, delivered as a fully dynamic Excel workbook (9 linked tabs, 685+ live formulas, zero hardcoded outputs). What's included: 1.Startup Costs — itemized pre-launch capital requirements with contingency buffer 2.Revenue Build — multi-stream revenue modeling with monthly detail for Year 1 and 3-year projections 3.Operating Expenses — fully categorized cost structure with annual escalation 4.Break-Even Analysis — automated contribution margin, break-even point, and margin of safety, with a visual chart 5.3-Year P&L Forecast — full income statement from revenue down to net income, monthly + annual 6.Cash Flow & Cash Requirement — monthly runway analysis with receivables/payables timing, pinpointing exactly when and how much additional cash is needed 7.Funding Requirement — Sources & Uses summary that ties out automatically, producing a clear capital ask Why it stands out: Every number is a live formula, not a static output — change one assumption and the entire model (break-even, forecast, cash runway, funding ask) recalculates instantly Color-coded inputs (blue), formulas (black), and cross-sheet links (green) so any user can navigate and edit safely Built to professional modeling standards — clean formatting, documented assumptions, verified formula integrity Ideal for: founders raising a pre-seed/seed round, small business owners applying for a loan, or accelerator/incubator applicants who need a credible, lender/investor-facing financial model fast.
1
124
1
Forward Sports (Pvt.) Ltd — Dynamic 5-Year Three-Statement Financial Model A fully-linked, scenario-driven financial model built in Excel for Forward Sports (Pvt.) Ltd, a Sialkot, Pakistan–based sporting goods manufacturer and exporter — forecasting FY2026–FY2030 off a FY2025 actual base year. Scope of work: 1.Scenario-Driven Assumptions — built a live scenario switch (Base / Upside / Downside) driving revenue growth (3%–13%) and COGS as a % of revenue (59%–64%) through OFFSET + MATCH formulas, so the entire model recalculates from a single dropdown input 2.Operating Expense Build-Up — modeled SG&A, R&D, and Marketing as % of revenue over the forecast period, feeding directly into the income statement 3.Income Statement — fully linked 6-year P&L (2025A–2030F) from revenue through COGS, gross profit, operating expenses, and net income, all formula-driven off the assumptions tab 4.Balance Sheet — dynamic 5-year balance sheet with automatic balance checks tying back to the income statement and cash flow 5.Cash Flow Statement — indirect-method cash flow statement (CFO/CFI/CFF), reconciling net income to the change in cash and linking to the Balance Sheet 6.Ratios & Summary — a KPI panel with margin, efficiency, and return ratios, plus SUMIFS-based period totals for revenue, net income, and marketing spend 7.Dashboard — a forecast-summary dashboard with a scenario selector and revenue/net income/EBITDA-margin charts (Base case: ~19% EBITDA margin through the forecast, Net Income growing from ~$5.0M to $5.8M FY2026F–FY2028F) Why it matters: Every figure flows from a single set of assumptions — change the active scenario and the entire model, from the P&L down to the dashboard chart, updates automatically. Nothing is hardcoded, which is exactly what makes it defensible in front of a client or professor. Skills demonstrated: Financial modeling · Three-statement integration · Scenario/sensitivity analysis · Advanced Excel (OFFSET, MATCH, SUMIFS, dynamic named ranges) · Dashboard design · Forecasting
1
89
0
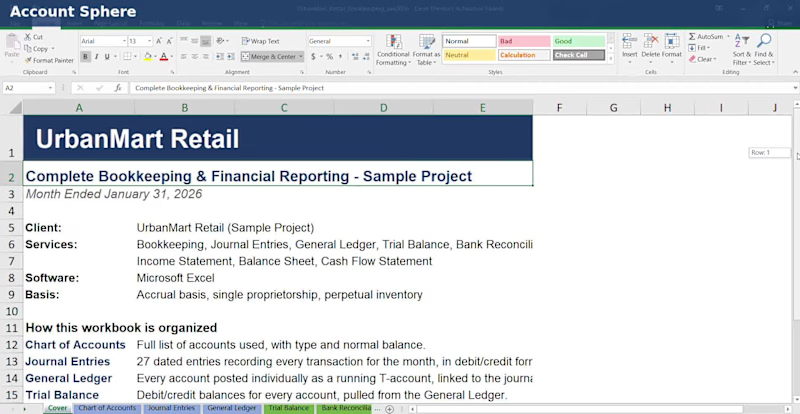
Title: UrbanMart Retail — Complete Monthly Bookkeeping & Financial Reporting (Excel) Description: A full-cycle monthly bookkeeping package built in Excel for a fictional retail business, showcasing end-to-end accounting workflow from raw transactions to finished financial statements. What's included: * Chart of Accounts — structured account codes, types, and normal balances * General Journal — 27+ dated transaction entries with debit/credit logic and memos * General Ledger — auto-posting from the journal with running balances per account * Trial Balance — pulled directly from the ledger, verified to balance to the cent * Bank Reconciliation — deposits in transit, outstanding checks, adjusted balances tying out to $0 difference * Income Statement — revenue, COGS, gross profit, and operating expenses * Balance Sheet — assets, liabilities, and owner's equity, with a built-in check that Assets = Liabilities + Equity * Statement of Cash Flows — indirect method, reconciling net income to ending cash Every statement is fully linked with live formulas — no hardcoded numbers — so the workbook updates automatically as transactions change, and every total is traceable back to its source. Skills demonstrated: double-entry bookkeeping, Excel formula design (cross-sheet references, IF logic), financial statement preparation, bank reconciliation, and accounting workflow documentation. (Sample project — all figures are illustrative for demonstration purposes.)
0
63
Financial Analyst
(5)
Follow
Message
Haadi Hassan
Lahore, Pakistan
Senior Accountant for US, UK & Australian Businesses
New to Contra
Follow
Message
Senior Accountant for US, UK & Australian Businesses
1
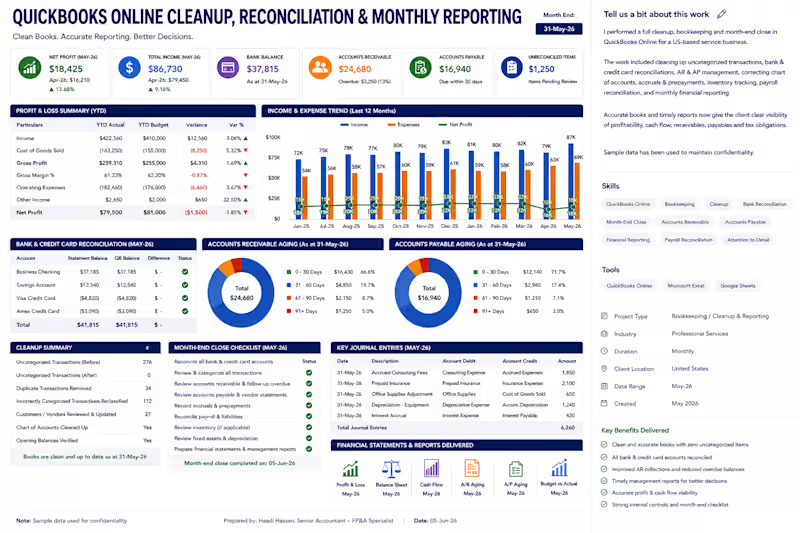
I performed a full QuickBooks Online cleanup, reconciliation, and month-end close for a US-based service business. The work included reviewing and correcting transaction classifications, cleaning up uncategorized and duplicate entries, reconciling bank and credit-card accounts, reviewing accounts receivable and payable, updating the chart of accounts, and recording accruals, prepayments, depreciation, and other adjusting journal entries. I also prepared monthly Profit and Loss, Balance Sheet, cash-flow, AR aging, AP aging, and budget-versus-actual reports. The completed cleanup gave management more reliable financial information, clearer visibility into cash flow and profitability, and a structured process for future monthly reporting. Sample data has been used to maintain confidentiality.
1
43
0
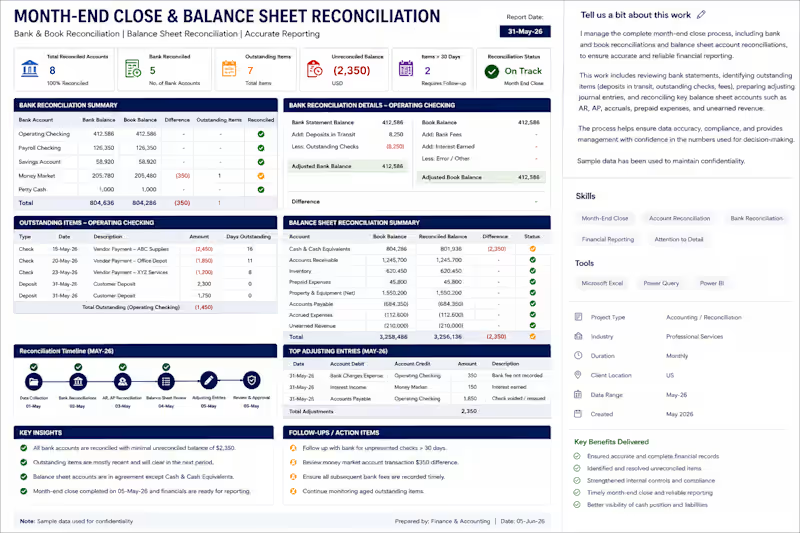
I managed a structured month-end close and balance-sheet reconciliation process to ensure the financial records were complete, accurate, and ready for management reporting. The work included bank and credit-card reconciliations, accounts receivable and payable reviews, accrual and prepayment entries, fixed-asset and depreciation updates, deferred-revenue analysis, intercompany reconciliations, and investigation of unusual general-ledger balances. These activities align with my experience directing close processes and maintaining supporting accounting schedules. I also maintained a reconciliation tracker to monitor account balances, supporting documents, unresolved differences, review status, ownership, and completion deadlines. This helped identify outstanding issues, strengthen financial controls, and support accurate and timely reporting. Sample data has been used to maintain confidentiality.
0
46
0
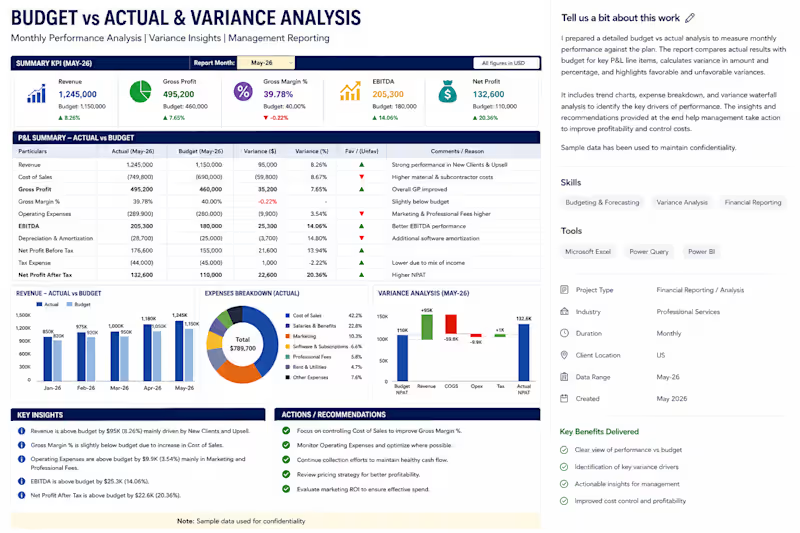
I prepared a detailed budget-versus-actual analysis to help management evaluate monthly and year-to-date financial performance against plan. The report compares actual results with budget across revenue, cost of sales, gross profit, operating expenses, EBITDA, and net profit. It calculates both value and percentage variances, identifies favorable and unfavorable movements, and explains the main drivers behind each significant variance. I also included trend analysis, visual summaries, management commentary, and recommended actions to support cost control, profitability improvement, and better financial decision-making. The model was designed as a reusable monthly reporting tool that can be updated after each accounting period is closed. Sample data has been used to maintain confidentiality.
0
48
0
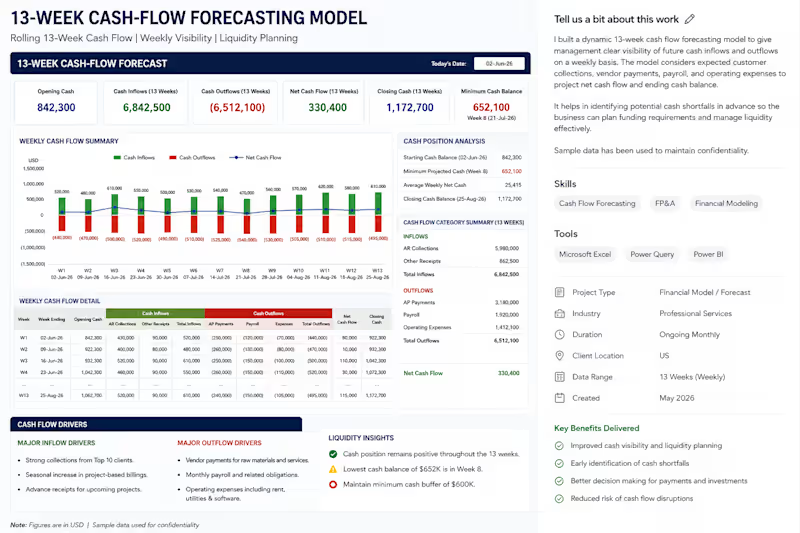
I developed a rolling 13-week cash-flow forecasting model to give management clear weekly visibility into future cash inflows, outflows, and liquidity requirements. The model brings together opening cash, expected customer collections, vendor payments, payroll, taxes, and operating expenses to calculate weekly net cash flow and projected closing balances. It also highlights the lowest projected cash position, potential shortfalls, and the main drivers of cash movement. The forecast can be updated each week using the latest AR, AP, and operational information, helping management prioritize payments, strengthen collection efforts, and plan funding requirements in advance. Sample data has been used to maintain confidentiality.
0
44
Financial Analyst
(5)
Follow
Message
Jawad Waseem
Gujranwala, Pakistan
Professional Forex Trader & Ecommerce Dropshipper
Follow
Message
Professional Forex Trader & Ecommerce Dropshipper
0
Binary Trading Strategy
0
11
0
Option Trading Strategy
0
12
0
Forex Trading Strategy
0
13
View more →
Financial Analyst
(3)
Follow
Message
Dilawar Rajput
Khushāb, Pakistan
Helping Businesses Work Smarter & Grow Better
New to Contra
Follow
Message
Helping Businesses Work Smarter & Grow Better
0
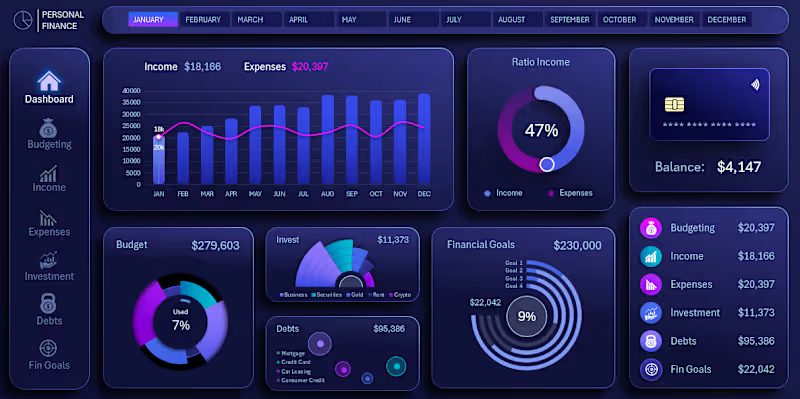
Finance Management Dashboard Designed a professional Finance Management Dashboard in Microsoft Excel to provide a clear overview of a business's financial performance, cash position, income, expenses, profitability, and outstanding balances. The dashboard brings important financial information into one organized interface, making it easier to monitor business performance and review financial data without working through multiple separate spreadsheets. Key Features Financial KPI Dashboard: Revenue, expenses, gross profit, net profit/loss, accounts receivable, and accounts payable. Income Management: Track income by source, category, amount, tax, payment method, account, and date. Expense Management: Organize operating, administrative, payroll, tax, capital, and miscellaneous expenses. Cash Flow Monitoring: Track money coming in and going out across business accounts. Customer/Client Ledger: Maintain transaction history, payments, running balances, and outstanding amounts. Supplier/Vendor Ledger: Track purchases, payments, balances, and amounts owed to suppliers. Bank & Cash Management: Monitor account balances, transfers, deposits, withdrawals, and reconciliation. Budget Tracking: Compare actual financial performance against planned budgets and identify variances. Profit & Loss Analysis: Review revenue, costs, expenses, gross profit, operating profit, and net profit. Financial Reporting: Structured financial reports for reviewing business performance over different periods. Data Visualization: Charts and visual summaries for sales, revenue, expenses, profit, and cash flow trends. Date-Based Analysis: Review financial performance by different time periods and compare historical results. Project Focus Finance Management • Business Analytics • Financial Dashboard • Excel Dashboard • Data Management • Financial Reporting • Business Operations
0
10
0
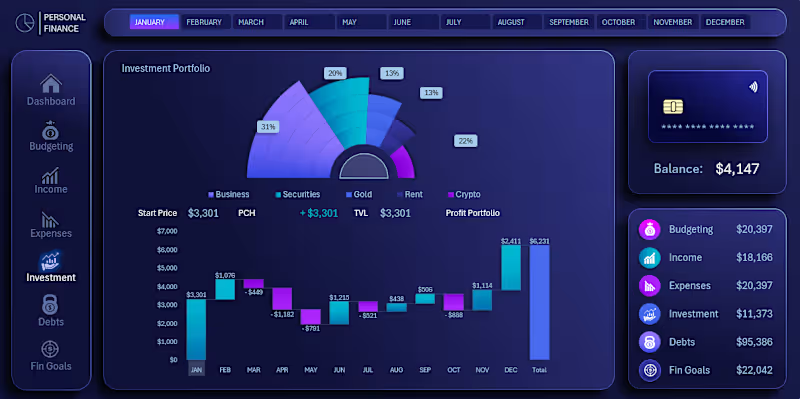
Investment Management Designed an organized Investment Management system in Microsoft Excel to help businesses track and monitor their investment portfolio, investment transactions, returns, current values, and overall portfolio performance. The system provides a centralized view of investments such as stocks, bonds, mutual funds, fixed deposits, real estate, and other business investments, allowing users to monitor investment costs, current values, expected returns, and profitability. Key Features Centralized investment portfolio tracking Investment name, type, and profile management Investment amount and purchase date tracking Current market value monitoring Expected return rate tracking Investment purchase and contribution records Withdrawal and investment sale tracking Dividend and interest income tracking Capital gains monitoring Cost basis vs. current value comparison Unrealized gain/loss analysis ROI and investment performance tracking Portfolio diversification analysis Investment maturity and renewal alerts Investment performance reports Project Focus Investment Management • Portfolio Tracking • ROI Analysis • Financial Analytics • Excel Dashboard • Investment Reporting
0
2
0
Budgeting & Forecasting Designed a structured Budgeting & Forecasting system in Microsoft Excel to help businesses plan their finances, monitor spending, compare actual performance with planned budgets, and make better financial decisions. The budgeting system allows users to create budgets for different categories, departments, or projects across monthly, quarterly, and yearly periods. Actual financial results can then be compared with budgeted amounts to identify spending differences and performance gaps. Key Features Monthly, quarterly, and yearly budget planning Category-wise budget management Department and project-based budgeting Actual vs. budget comparison Variance amount and percentage analysis Expense monitoring against planned budgets Financial performance tracking Historical data-based forecasting Cash flow and profitability forecasting Budget threshold and overspending alerts Visual charts and financial summaries Easy-to-understand Excel dashboard layout Project Focus Budget Management • Financial Planning • Forecasting • Variance Analysis • Excel Dashboard • Business Finance
0
6
0
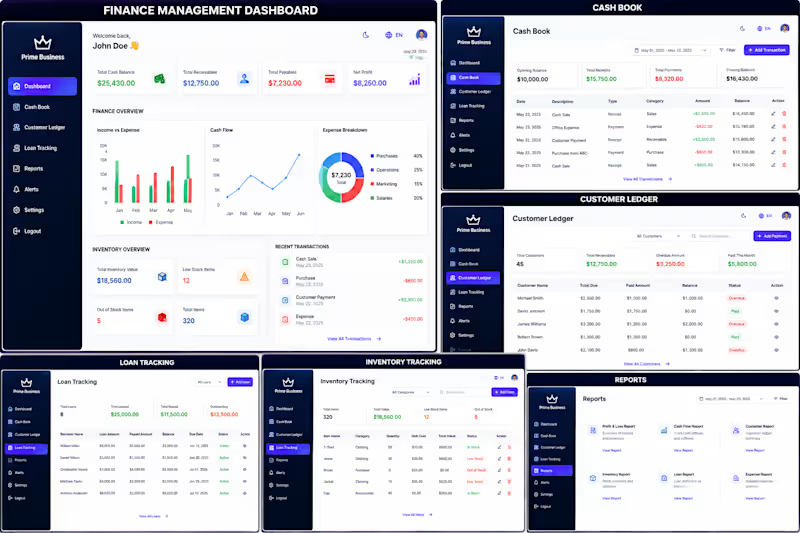
A professional Finance Management Dashboard designed to help businesses organize and monitor their financial activities in one place. The dashboard provides a clean and easy-to-use interface for tracking income, expenses, cash flow, customer transactions, loans, financial summaries, and reports. The design focuses on clear data presentation, simple navigation, and practical business use. This work sample demonstrates my ability to design professional business dashboards, financial management interfaces, data-driven layouts, and user-friendly web application interfaces with a focus on usability and organized information. Key Features: Finance overview and financial summaries Income and expense tracking Cash book management Customer ledger Loan tracking Financial reports Clean and responsive dashboard interface Organized data visualization Business-focused UI/UX design
0
15
Financial Analyst
(1)
Follow
Message
Usama Zulfiqar
Gujranwala, Pakistan
A senior full-stack developer and AI/ML specialist
Follow
Message
A senior full-stack developer and AI/ML specialist

0
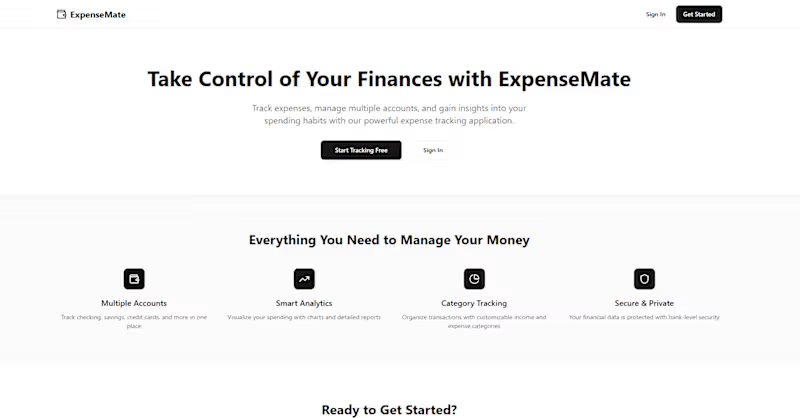
ExpenseMate is a full-stack personal finance and expense tracking application designed to help individuals manage all their finances in one place. The platform allows users to create multiple accounts, track income and expenses, monitor balances in real time, and visualize spending patterns through interactive dashboards. It solves the common problem of scattered financial tracking by bringing bank accounts, cash, investments, and loans into a single, organized system that is easy to use and accessible from anywhere. The application is built for everyday users, freelancers, and small business owners who need better visibility into their financial activity. With secure user authentication and isolated data, ExpenseMate provides a reliable way to monitor financial health, identify spending trends, and make informed decisions. The clean dashboard, responsive interface, and real-time calculations create a smooth experience while maintaining accuracy across accounts and transactions. Users can create multiple accounts with different currencies, track income and expenses, transfer funds between accounts, manage personal loans, and organize transactions using hierarchical categories. The platform includes advanced filtering, search, and CSV export capabilities, along with interactive charts showing monthly trends and category-based spending. Additional features include drill-down analytics, account balance tracking, dark and light themes, secure authentication, and a responsive data table for managing transactions efficiently. Built using Next.js, TypeScript, Tailwind CSS, shadcn/ui, Supabase, PostgreSQL, Zustand, TanStack Table, and Recharts. A scalable and user-friendly finance tracking solution designed to simplify money management and provide clear financial insights for real-world use. #NextJS #Fintech #ExpenseTracker #PersonalFinance #WebApplication #FullStackDevelopment #TypeScript #Supabase #DashboardDesign #SaaSDevelopment
0
53
1
Kua Sky is a niche e-commerce brand built exclusively for the skydiving community, offering premium performance clothing and gear designed for athletes who demand both function and style in the air. The platform solves a real gap in the market skydiving apparel has historically been generic or limited by delivering sport-specific gear, from freefly jumpsuits to outerwear and accessories, all tailored to the demands of the sport and the identity of the athlete wearing it. What sets this project apart is the custom suit designer, a live interactive coloring application that lets customers design their own jumpsuit and visualize the final product in real time before placing an order. This eliminates purchase hesitation and dramatically improves buyer confidence for high-ticket items. The store also supports custom jersey and face shield orders, a curated catalog of in-stock and sublimated jumpsuits, free shipping incentives, international shipping, gift cards, and a brand ambassador program that drives community-led growth. The platform is built on WordPress with WooCommerce handling the full e-commerce experience, supported by a custom visual product configurator, wishlist functionality, and an integrated account and order management system. Kua Sky is a strong example of a vertical commerce build purpose-built for a passionate niche, with the kind of customization tooling and brand depth that turns first-time buyers into loyal community members. #ecommerce #woocommerce #wordpress #customproductdesigner #nicheecommerce #sportswear #outdoorapparel #skydiving #customclothing #visualconfigurator #brandbuilding #onlineshop #performancegear #webdevelopment #shopdesign
1
50
0
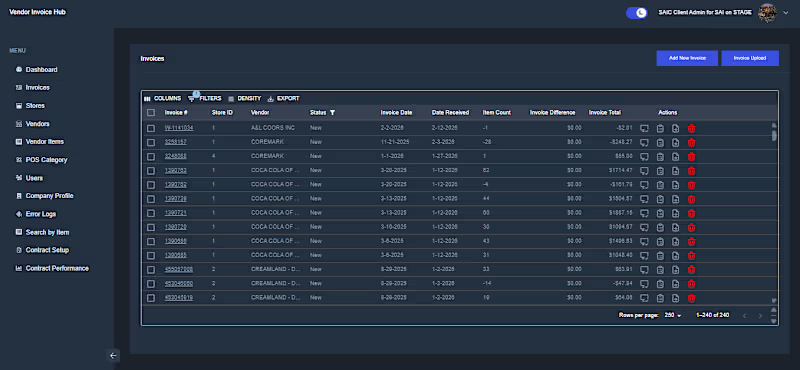
VendorInvoiceHub (VIH) is an enterprise-grade SaaS platform built to streamline vendor invoice acquisition, processing, and contract cost validation for retail chains and convenience store operators. The platform eliminates manual invoice reconciliation by automating invoice ingestion, extracting line-item data, and validating vendor pricing against negotiated contracts. This helps businesses detect overbilling, reduce operational overhead, and gain full transparency into vendor performance while managing multiple organizations within a secure multi-tenant environment. Designed for finance teams, store managers, and operations leaders, VendorInvoiceHub provides a centralized system to manage invoices, vendors, stores, and pricing agreements in one place. The platform supports high-volume invoice processing, AI-powered data extraction, and real-time analytics, allowing businesses to track compliance, identify cost discrepancies, and improve procurement decisions. With cloud-based deployment and scalable architecture, the solution supports enterprise-level workloads while maintaining performance and data isolation across tenants. The system includes automated invoice ingestion via file upload or integrations, AI-powered OCR extraction of invoice data, contract cost validation with variance detection, vendor and store management, proof-of-delivery reconciliation, real-time dashboards and analytics, role-based user access, multi-tenant configuration, exception reporting, Excel and PDF exports, background processing for large workloads, error tracking, and audit logging to ensure reliability and compliance. Built using React, TypeScript, Tailwind CSS, Material UI, Django, Django REST Framework, PostgreSQL, Redis, Celery, AWS S3, Docker, and cloud deployment . A scalable financial operations platform that helps retail businesses reduce vendor overbilling, automate invoice workflows, and gain real-time visibility into procurement and cost performance. #SaaS #EnterpriseSoftware #React #Django #FinTech #RetailTech #InvoiceAutomation #B2BSoftware #CloudApplications #MultiTenant #AIProcessing #BusinessAutomation
0
43
0
Twin Frontend (Lyona App) is a dual-platform conversational AI application designed to power both web and mobile experiences from a single shared codebase. Built with a modern monorepo architecture, the platform enables real-time AI conversations, voice interactions, and dynamic interface rendering, allowing businesses to deploy scalable conversational products quickly. The system addresses the challenge of building and maintaining separate applications by unifying business logic, UI behavior, and communication layers across platforms, reducing development time while ensuring consistent user experiences. The platform is built for organizations developing AI assistants, customer support tools, SaaS dashboards, or conversational applications that require real-time responsiveness and cross-device synchronization. Users can interact with AI through text or voice, while the interface dynamically adapts based on backend-driven UI configurations. With enterprise-grade performance, secure authentication, and real-time updates, the application supports scalable deployments and continuous feature expansion without rebuilding separate frontends. The application includes real-time AI chat with streaming responses, voice recording and playback for conversational interaction, dynamic UI rendering with dashboards, forms, tables, charts, and interactive components, cross-platform synchronization between web and mobile, push and in-app notifications, secure authentication and session handling, role-based access control, performance optimization with lazy loading and memoization, automatic reconnection and error handling, and shared state management ensuring consistent behavior across devices. Built using React, React Native, TypeScript, Tailwind CSS, Ant Design, Material UI, Redux Toolkit, Socket.IO (http://Socket.IO), Docker, Kubernetes, and modern CI/CD infrastructure. A scalable conversational AI foundation designed to accelerate development of real-time, cross-platform AI applications for enterprise and SaaS environments. #ConversationalAI #React #ReactNative #SaaSDevelopment #AIApplications #RealtimeApps #TypeScript #WebDevelopment #MobileDevelopment #EnterpriseSoftware #Monorepo #ReduxToolkit
0
46
Financial Analyst
(1)
Follow
Message
SAAD WAKEEL
Lahore, Pakistan
"CMA | Accounts Executive | 6+ Years in Finance |
New to Contra
Follow
Message
"CMA | Accounts Executive | 6+ Years in Finance |
0
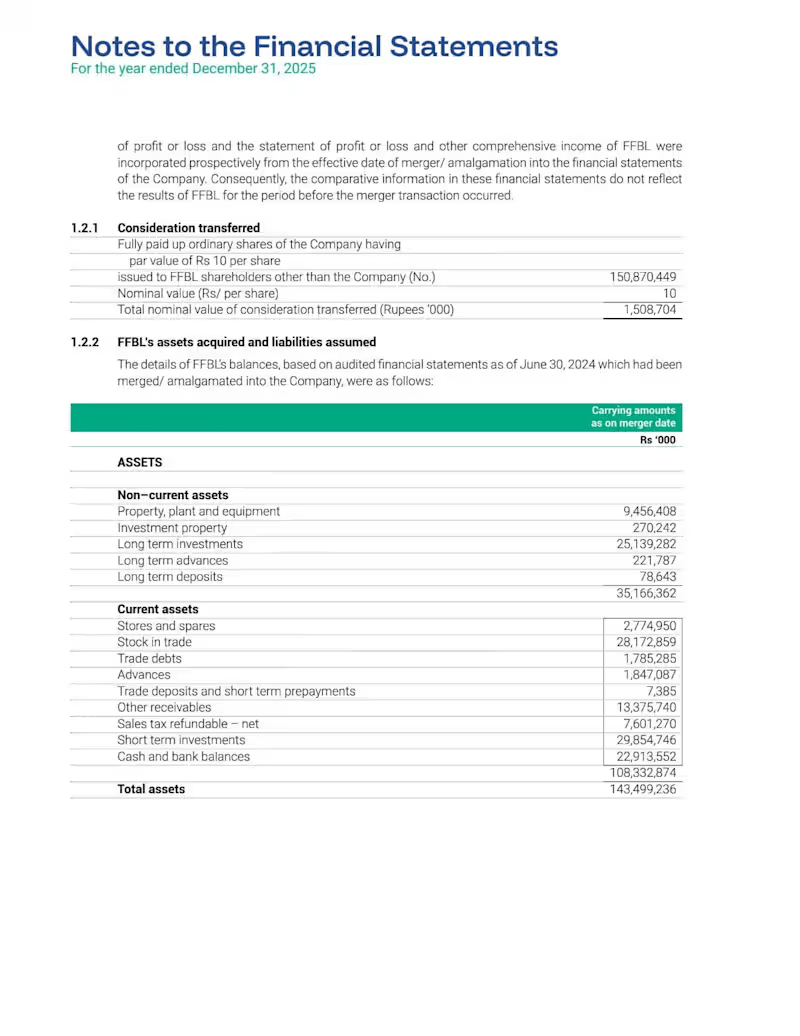
Notes To The Financial Statements For The Year Ended December 31, 2025 Company Name: FFC (Fauji Fertilizer Company)
0
28
0
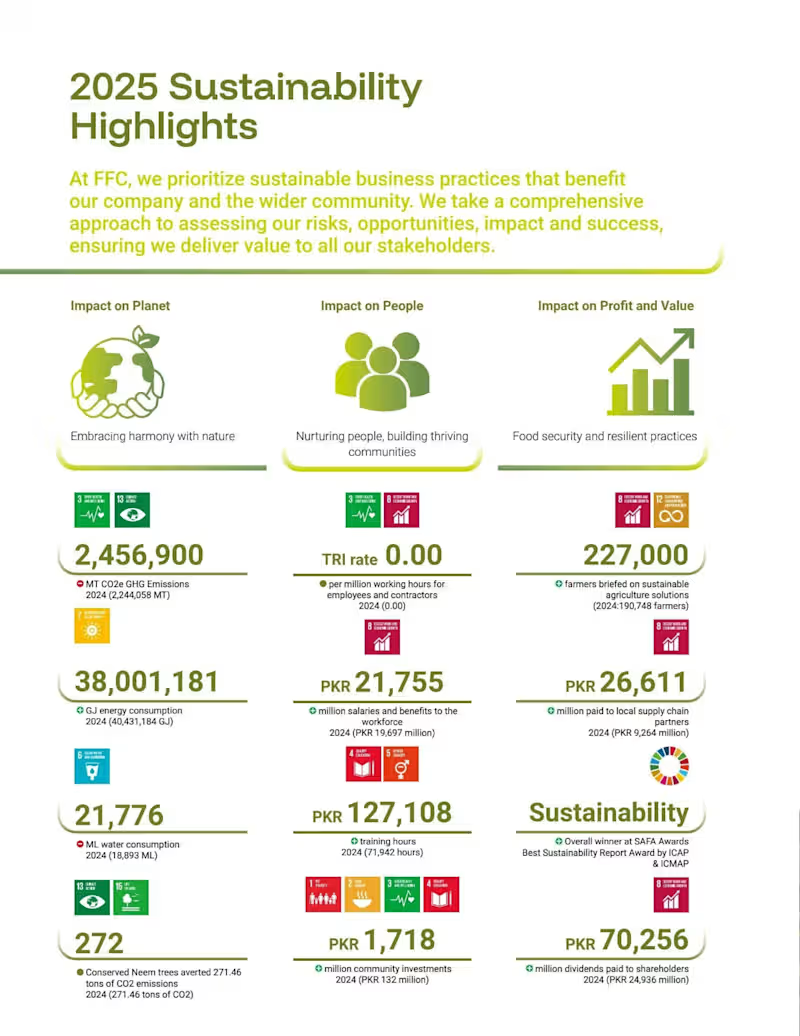
2025 Sustainability Highlights Company Name: FFC (Fauji Fertilizer Company)
0
25
0
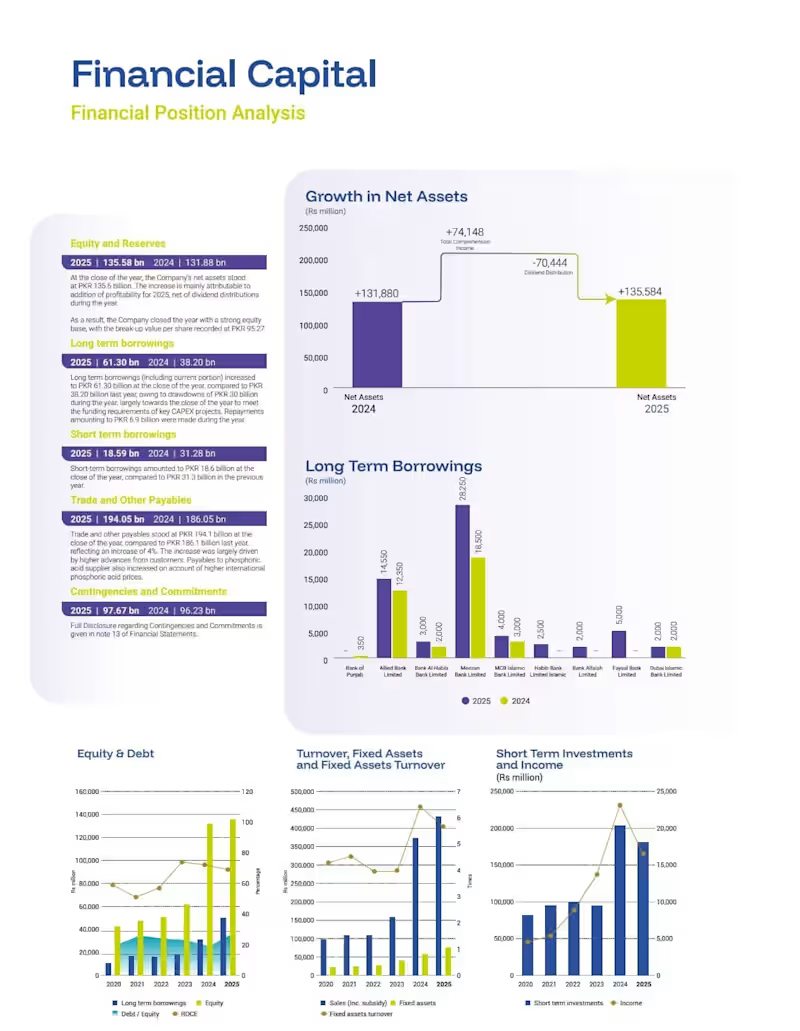
Financial Capital Report (Financial Position Analysis) Company Name: FFC (Fauji Fertilizer Company)
0
36
0
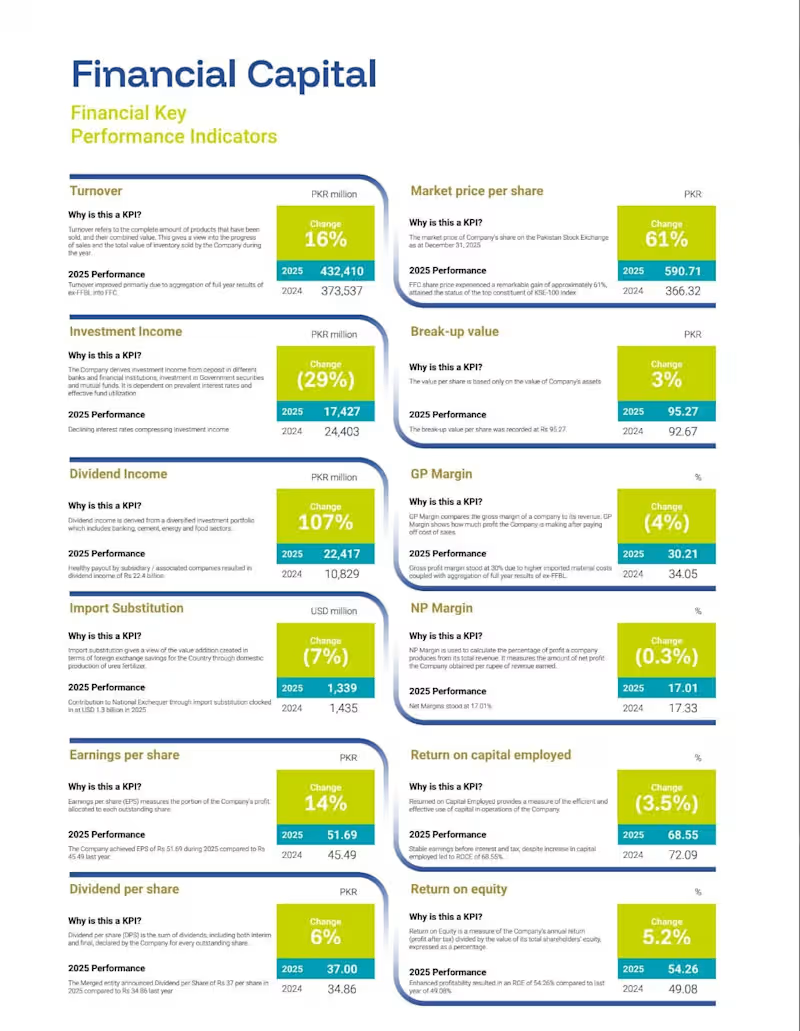
Financial Capital Report (Financial Key Performance Indicators) Company Name: FFC (Fauji Fertilizer Company) Financial Year 2025
0
37
Financial Analyst
(6)
Follow
Message
Imaad Mahmood
Bahawalpur, Pakistan
Data Scientist | Data Analyst | Machine Learning
Follow
Message
Data Scientist | Data Analyst | Machine Learning
1
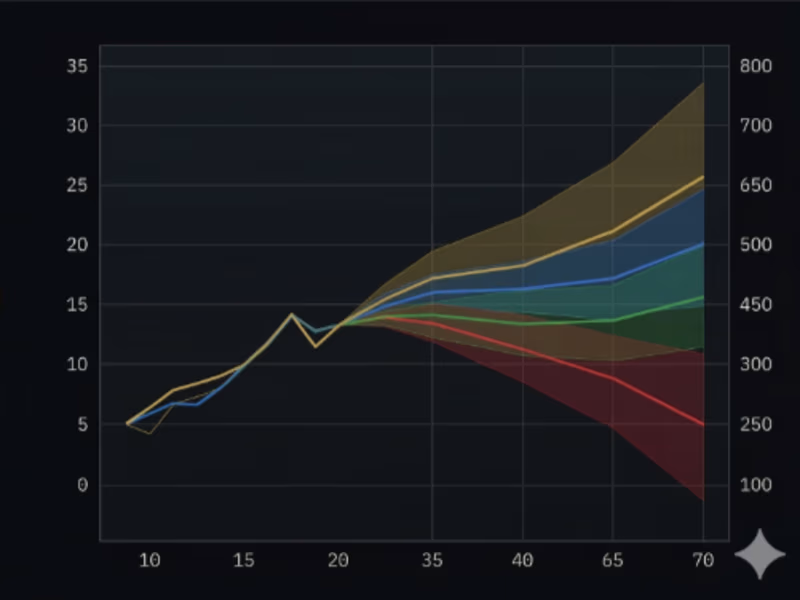
FinCast Pro Development
1
11
1
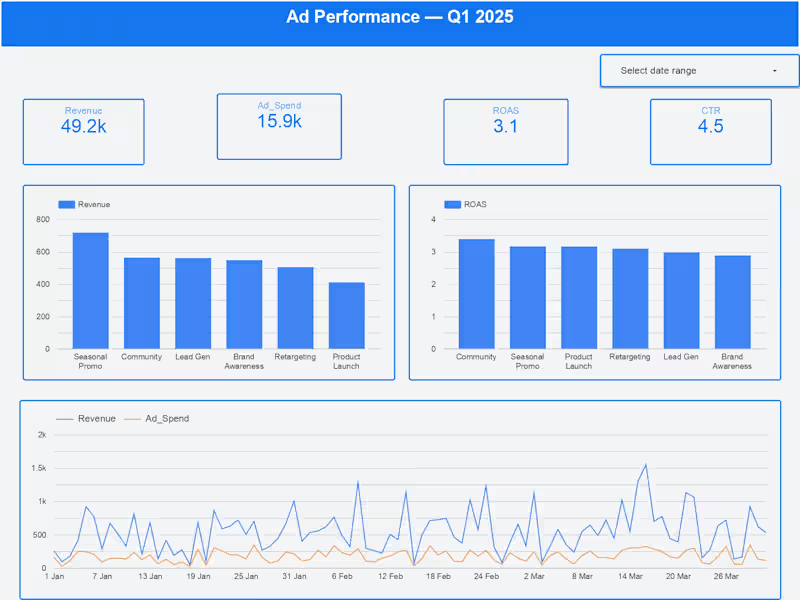
How do you turn $15.9K in ad spend into $49.2K in revenue? You stop guessing and start tracking Running paid social campaigns without granular visibility is essentially burning budget. For this Q1 2025 performance tracker, the goal wasn't just to make pretty charts—it was to build an automated, actionable intelligence tool that immediately identifies where marketing dollars are generating the highest return. The Data-Driven Insights: By analyzing over 2.7 million impressions and 1.8 million unique reach, this dashboard uncovered the exact levers driving profitability: 🚀 The ROI Engine: The overarching strategy yielded a highly profitable 3.1 Return on Ad Spend (ROAS). 🏆 Winning Formats: Carousel ads heavily dominated the space, capturing 21.9% of the share, proving that interactive, multi-image formats win the algorithm. 📅 Timing is Everything: Engagement rates spiked massively on Saturdays, reaching near 20%, indicating the optimal window for scaling ad spend. 🎯 Campaign Economics: While "Seasonal Promos" drove the highest total top-line revenue , the "Community" campaigns actually delivered the most efficient ROAS.
1
60
3
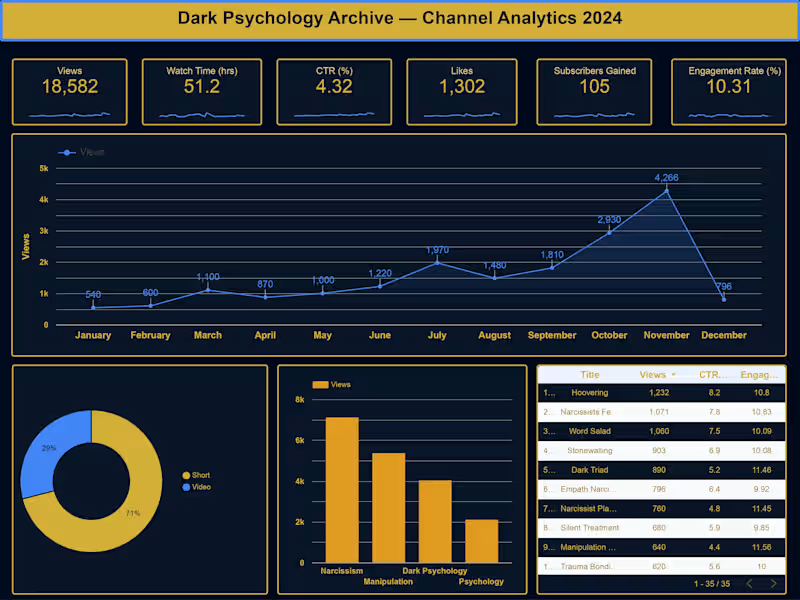
Built a full YouTube analytics dashboard in Google Looker Studio using real channel data from Dark Psychology Archive. The dashboard tracks 6 KPIs — Views (18,582), Watch Time (51.2 hrs), CTR (4.32%), Likes (1,302), Subscribers Gained (105), and Engagement Rate (10.31%). A monthly trend line reveals the growth curve peaking at 4,266 views in November. Content-type breakdown shows Shorts drive 71% of total views. Top performer: Hoovering at 1,232 views with 8.2% CTR. Built to help content creators make data-driven decisions on what to post, when, and in what format — without exporting CSVs manually.
3
144
1
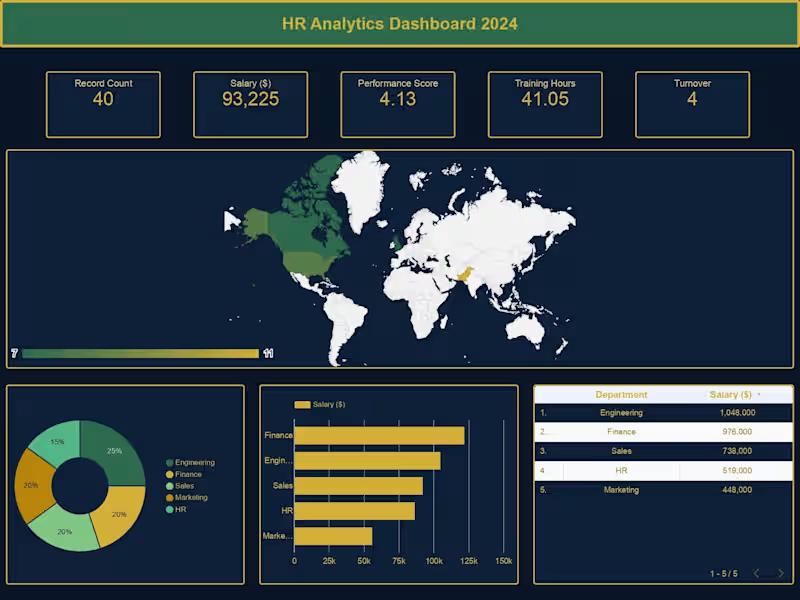
HR teams spend hours every week pulling salary, performance, and turnover data from separate spreadsheets. This dashboard puts all of it in one place — live. Built this HR Analytics Dashboard in Google Looker Studio with 5 KPI cards, department salary breakdown, geo distribution map, and a ranked leaderboard sorted by total compensation. Engineering leads at $1.05M total salary. Finance close behind. Decision-makers can see that in 3 seconds instead of 3 hours.
1
167
Financial Analyst
(1)
Follow
Message
Ihtisham Ulhaq
Rawalpindi, Pakistan
UK Accountant | Bookkeeping & Tax Specialist
New to Contra
Follow
Message
UK Accountant | Bookkeeping & Tax Specialist
1
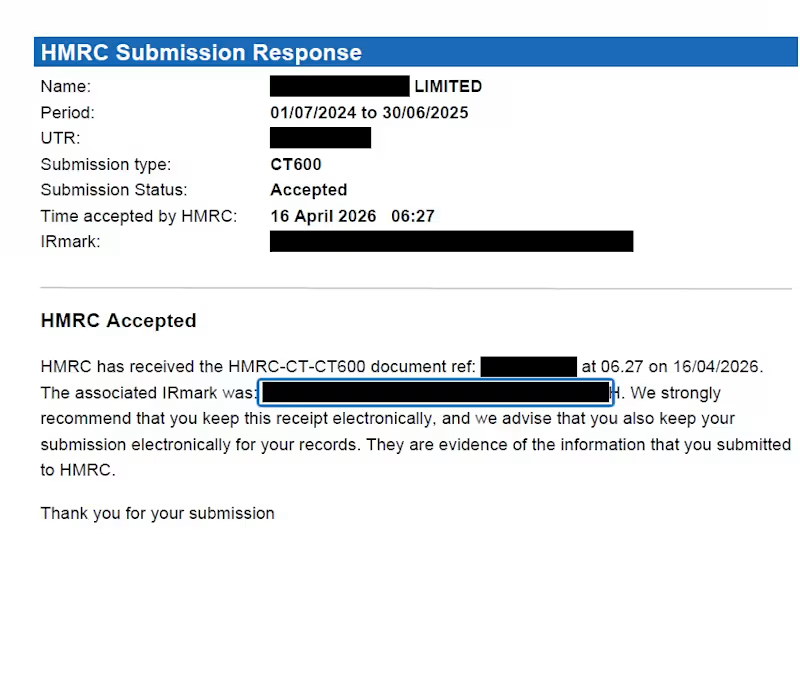
HMRC Corporation Tax Return Submission
1
273
0
UK Bookkeeping Services | QuickBooks Online & Xero
0
57
0
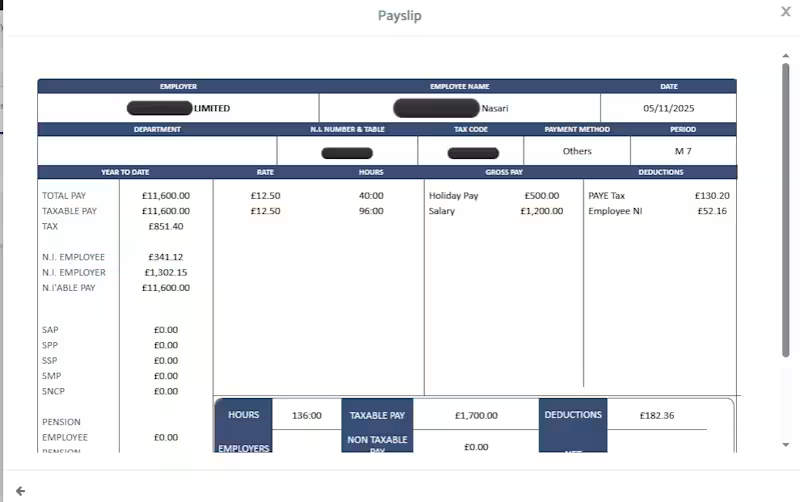
UK Payroll & PAYE — RTI Filed & HMRC Accepted
0
91
0
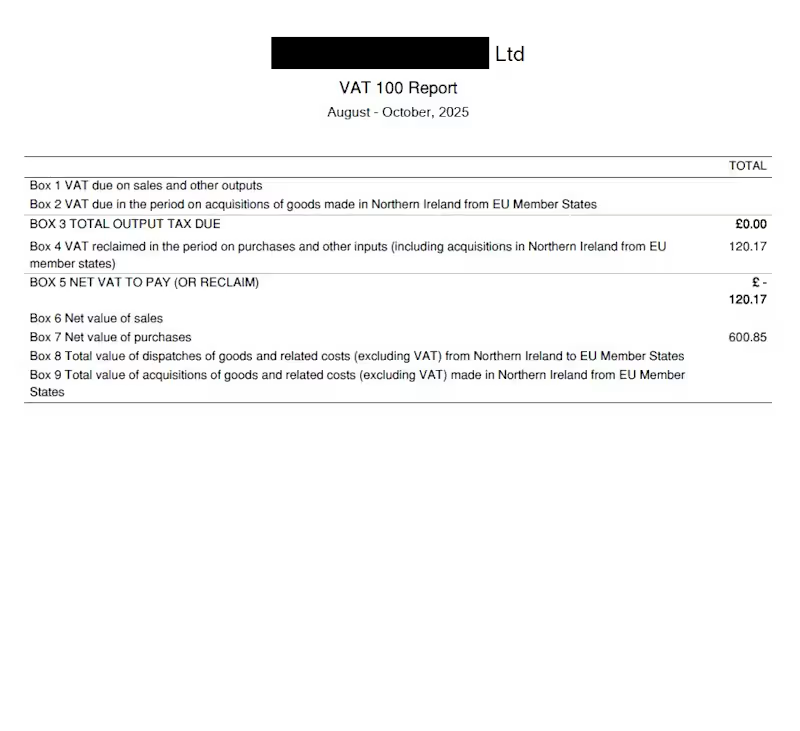
UK MTD VAT Return — HMRC Accepted
0
74
Financial Analyst
(1)
Follow
Message
Explore people