The network for creativity
Join 1.25M professional creatives like you
Connect with clients, get discovered, and run your business 100% commission-free
Creatives on Contra have earned over $150M and we are just getting started
Back to feedPost

Title: UrbanMart Retail — Complete Monthly Bookkeeping & Financial Reporting (Excel)
Description:
A full-cycle monthly bookkeeping package built in Excel for a fictional retail business, showcasing end-to-end accounting workflow from raw transactions to finished financial statements.
What's included:
* Chart of Accounts — structured account codes, types, and normal balances
* General Journal — 27+ dated transaction entries with debit/credit logic and memos
* General Ledger — auto-posting from the journal with running balances per account
* Trial Balance — pulled directly from the ledger, verified to balance to the cent
* Bank Reconciliation — deposits in transit, outstanding checks, adjusted balances tying out to $0 difference
* Income Statement — revenue, COGS, gross profit, and operating expenses
* Balance Sheet — assets, liabilities, and owner's equity, with a built-in check that Assets = Liabilities + Equity
* Statement of Cash Flows — indirect method, reconciling net income to ending cash
Every statement is fully linked with live formulas — no hardcoded numbers — so the workbook updates automatically as transactions change, and every total is traceable back to its source.
Skills demonstrated: double-entry bookkeeping, Excel formula design (cross-sheet references, IF logic), financial statement preparation, bank reconciliation, and accounting workflow documentation.
(Sample project — all figures are illustrative for demonstration purposes.)


The network for creativity
Join 1.25M professional creatives like you
Connect with clients, get discovered, and run your business 100% commission-free
Creatives on Contra have earned over $150M and we are just getting started











Related posts

Title: The Runaway Paintbrush 🎨 | CapCut World LA Challenge
Description:
What if a runaway paintbrush could take you on the most unexpected journey? 🎨✨
For my second entry in the CapCut World LA challenge, I created an imaginative AI video featuring a magical paintbrush, a colorful fantasy adventure, and an unexpected arrival at CapCut World LA.
Created using AI visuals, creative storytelling, character dialogue, and cinematic transitions in CapCut.
#CapCutWorld #CapCutWorldLA


Thanks for joining the CapCut World LA Challenge! 🌟 Just flagging: the submission requirements ask for your social post link along with the final video and project link. This helps us verify and feature your post — could you add it to your submission or share it in the comments below? Appreciate it!

How I Built an End-to-End Sales Analytics Dashboard in Excel for an E-commerce Company
I recently completed an end-to-end sales analytics project using Microsoft Excel, transforming raw e-commerce sales data into an interactive dashboard that provides meaningful business insights.
In this project, I explored the data, performed analysis, identified key sales trends, and built an interactive dashboard to help businesses make data-driven decisions.
I documented the entire process, including the approach, tools, analysis, and dashboard development.
Read the full project walkthrough on Medium: https://medium.com/@Refino/how-i-built-an-end-to-end-sales-analytics-dashboard-in-excel-for-an-e-commerce-company-e8692d81f354


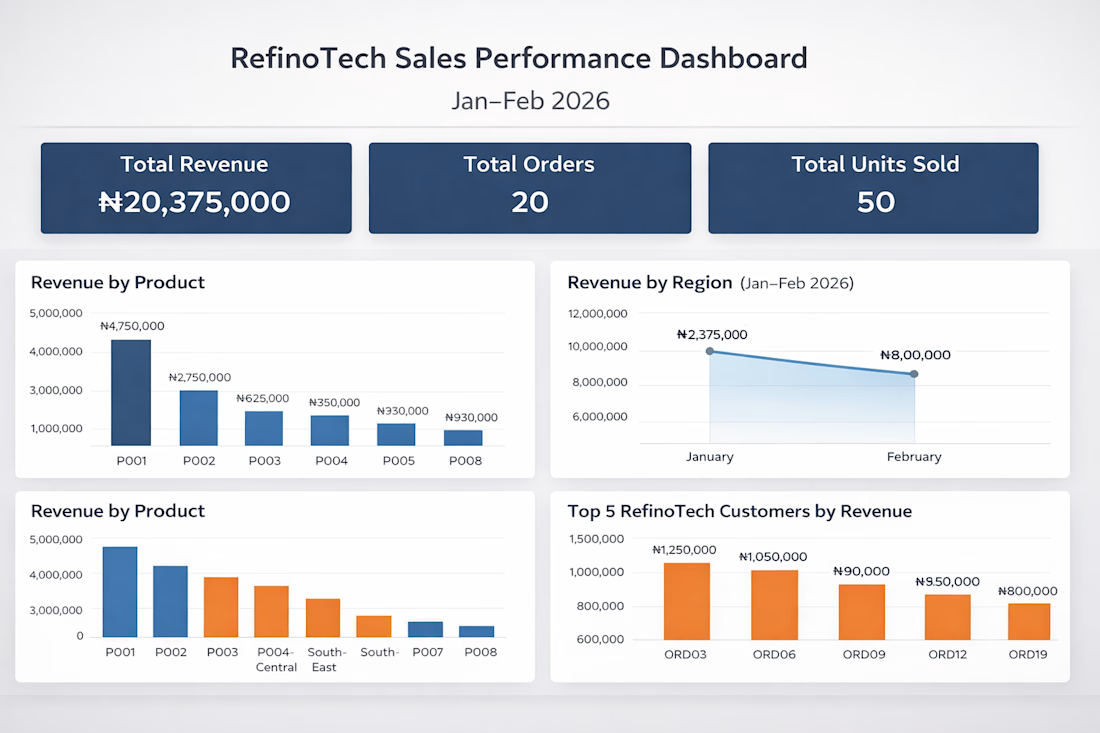

Excellent work! Turning raw data into actionable business insights is a valuable skill.

SaaS Runway & Burn Dashboard for Founders
An interactive dashboard that shows founders how long their cash will last. Change hiring, revenue growth or expenses and see runway, burn and cash-out date update instantly. Built as a demo of the financial dashboards I create for early-stage startups.
financialmodelingfinancialforecastingstartupfinanceData VisualizationFinancial PlanningFinancial AnalysisGoogle SheetsMicrosoft ExcelPython


Letting founders drag a hiring slider and watch the cash-out date move is what makes runway real. A spreadsheet gives them a number; this shows the cost of each decision before they make it.