Projects using MySQL in Pimpri-ChinchwadProjects using MySQL in Pimpri-ChinchwadBlinkit-Sales-Dashboard
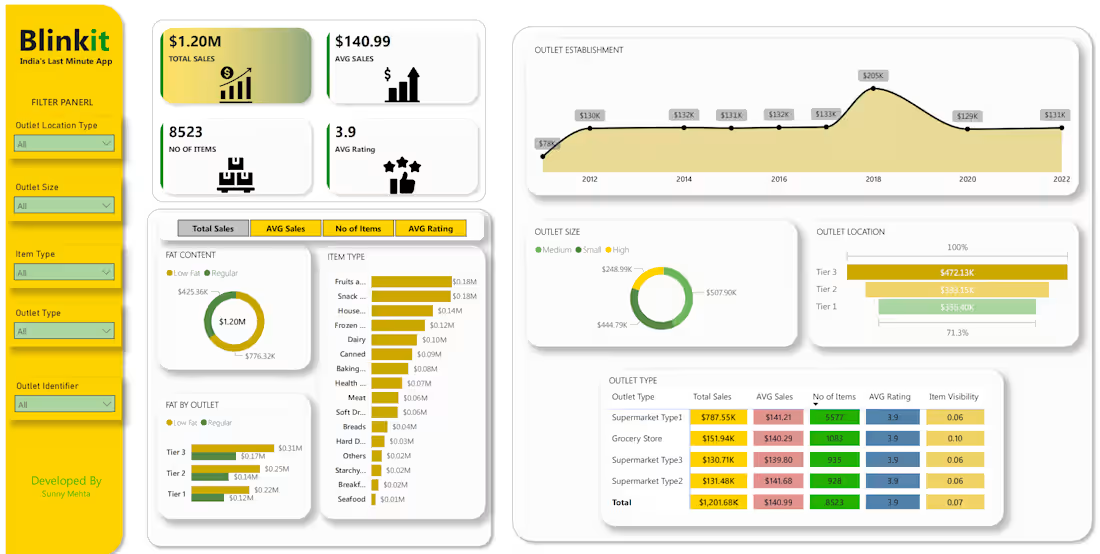
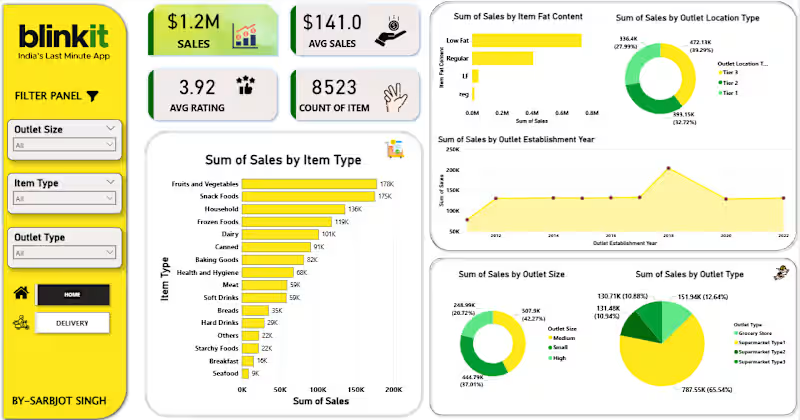
This project is an interactive Power BI dashboard developed to analyse Blinkit's sales performance, outlet operations, product distribution, and customer-related metrics. The dashboard converts raw retail sales data into meaningful business insights through visualisation and KPI tracking. The objective of this project is to monitor business performance, identify sales trends, evaluate outlet efficiency, and support data-driven decision-making.
Key KPIs
Total Sales: $1.20M
Average Sales: $140.99
Number of Items: 8,523
Average Rating: 3.9
Dashboard Features
Sales Analysis
Tracked total revenue and average sales performance to understand overall business growth.
Outlet Performance
Analysed outlet sales based on the following:
Outlet Size
Outlet Location Type
Outlet Establishment Year
Outlet Type
Product Category Analysis
Identified top-performing product categories contributing the highest revenue.
Customer & Product Insights
Compared low-fat and regular products to understand purchasing trends and monitored customer ratings for performance evaluation.
Interactive Filters
Added slicers for:
Outlet Location Type
Outlet Size
Item Type
Outlet Type
Outlet Identifier
These filters allow users to dynamically explore data and generate business insights.
Project Outcome
This project demonstrates practical skills in business intelligence, KPI reporting, analytical thinking, and dashboard development using Power BI. It highlights the ability to transform raw business data into business insights for decision-making.
Developed By
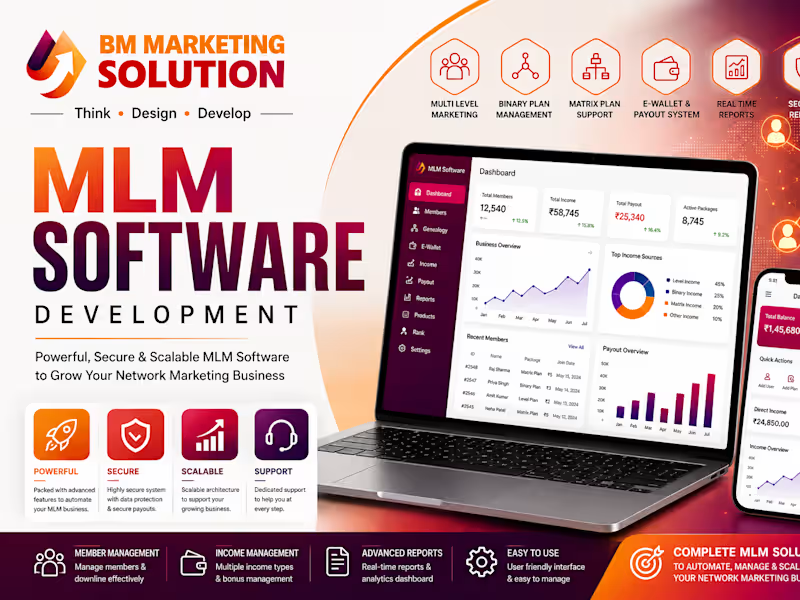
Sunny Mehta Get complete control over your network marketing business with a centralized, automated administration hub. Based on the robust architecture of MLM Engine, I deliver secure, highly customizable, and "India-Ready" MLM platforms designed to manage your entire downline layout and process accurate commission calculations without glitching.
What you will get:
• Fully custom compensation plans (Binary with leg balancing calculators, Forced Matrix N×N plans, Single Leg, and Generation structures)
• Centralized Admin & Distributor Command Centers (Real-time tracking of registration, sales volume, and conversion rates)
• Secure automated E-Wallet & E-Pin transaction frameworks for payouts and digital token management
• Regional Indian integrations (GST-compliant digital invoicing, UPI payment gateways, and automated WhatsApp notifications)
MLM Software, Network Marketing, Binary Plan, Matrix Plan, Generation Plan, FinTech, E-Wallet System, E-Commerce Integration, Software Development