Delivering Strategic Growth Through Data, Finance & Tech.
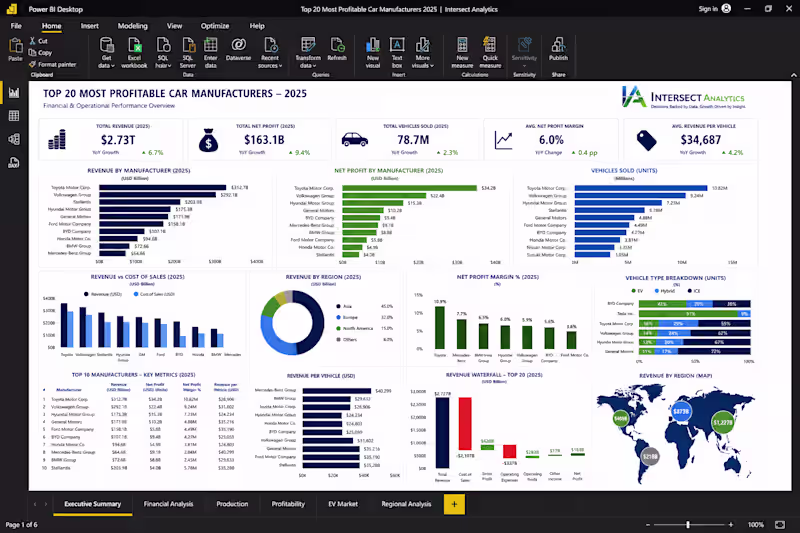
Data Analyst | Data Engineer
Data Analyst | Data Engineer

View more →
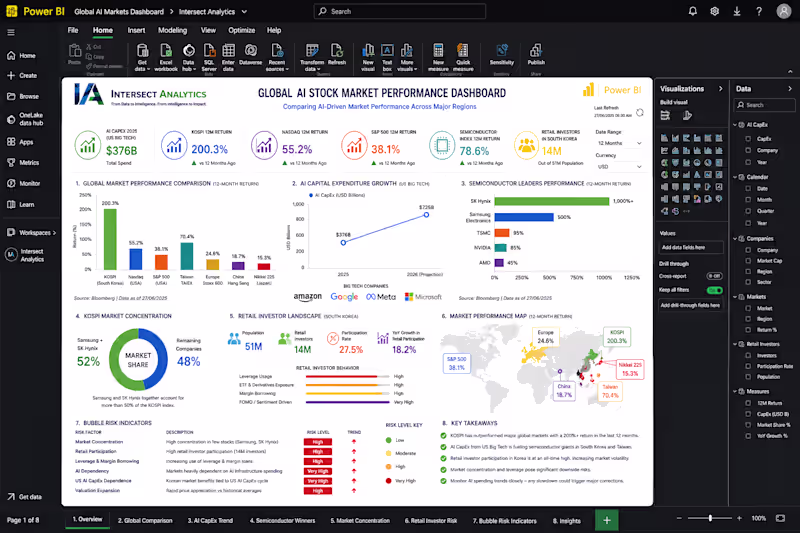
Turning Complex Data into Actionable Insights
Turning Complex Data into Actionable Insights


✨Turning your vision into stunning, Liveable spaces✨


Web Designer | UI/UX Designer| Graphic Designer |
Expert Data Analyst: Transforming Data to Insight
Expert Data Analyst: Transforming Data to Insight

View more →
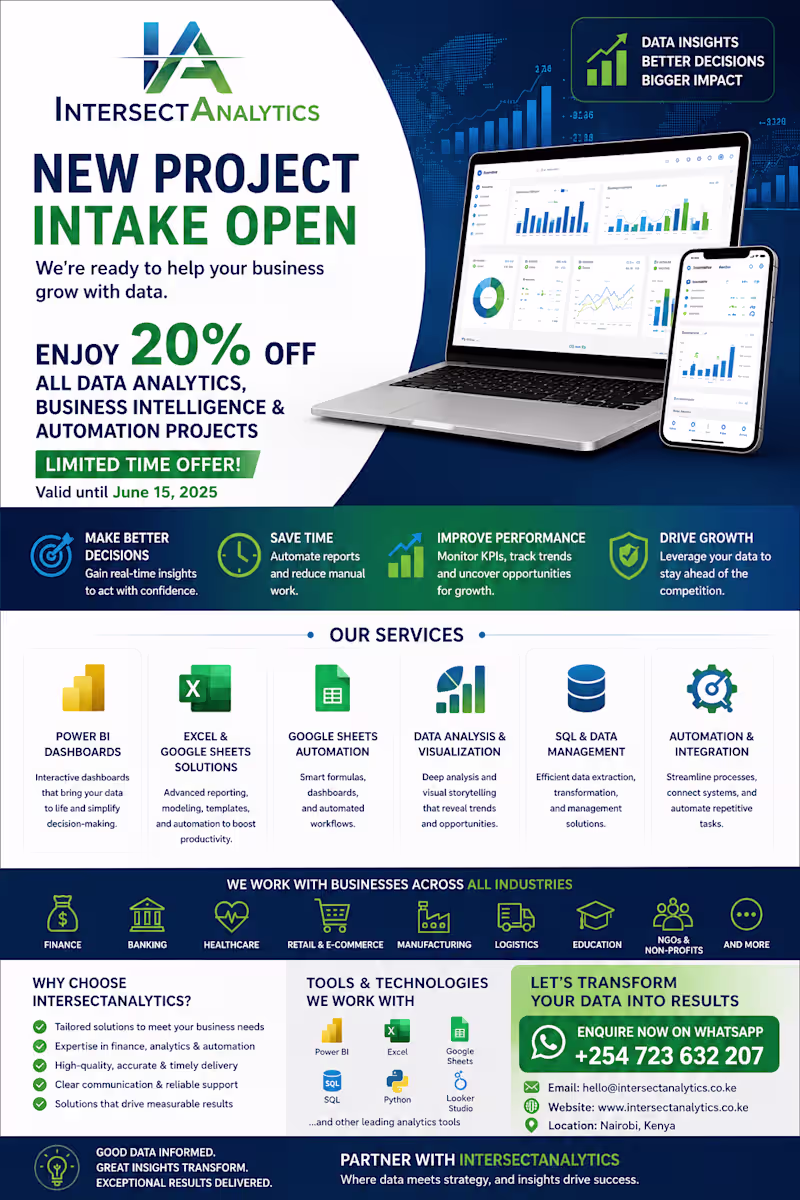
Presentations, Infographics & Graphic Design Pro
Presentations, Infographics & Graphic Design Pro


View more →
GIS | Data Analysis | Remote Sensing | Cartography
GIS | Data Analysis | Remote Sensing | Cartography