Freelancers using Tableau in MumbaiFreelancers using Tableau in Mumbai
I build AI-powered data apps and dashboards
11
Followers
I build AI-powered data apps and dashboards
Cover image for Project Overview This is a personal portfolio and services s...
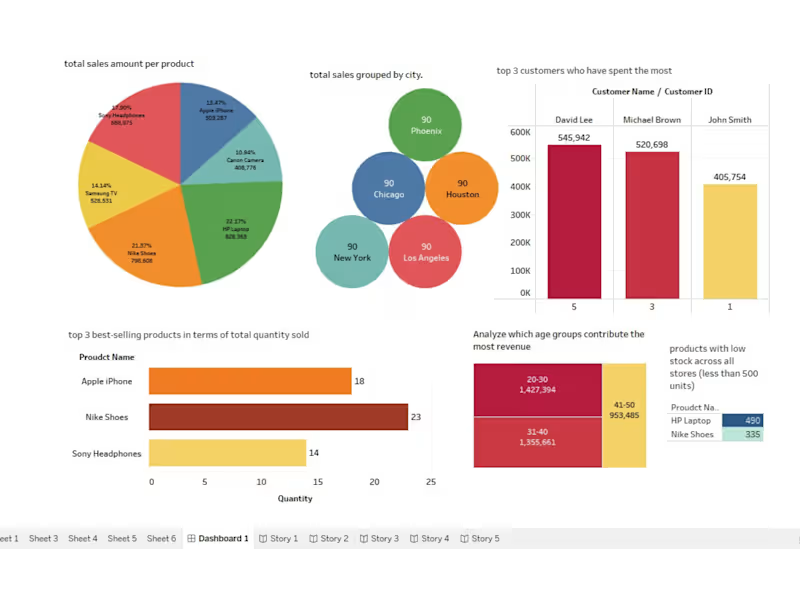
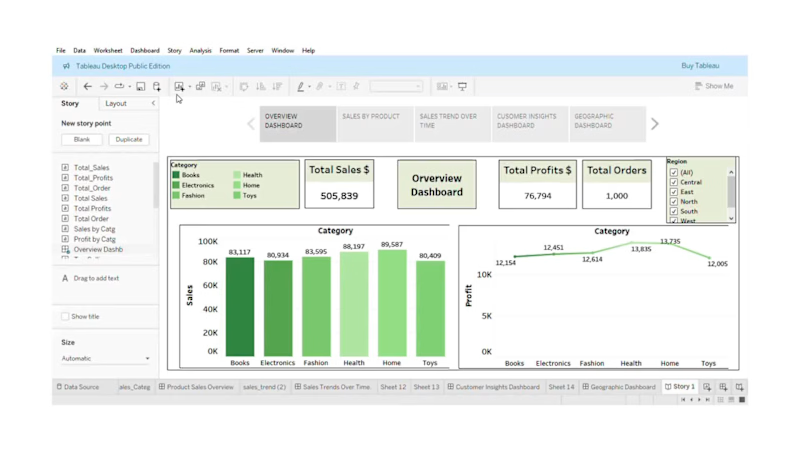
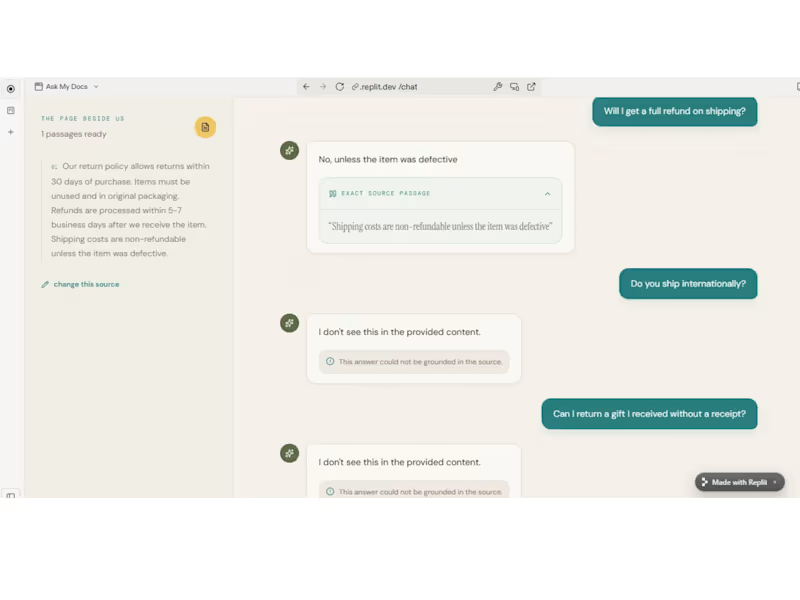
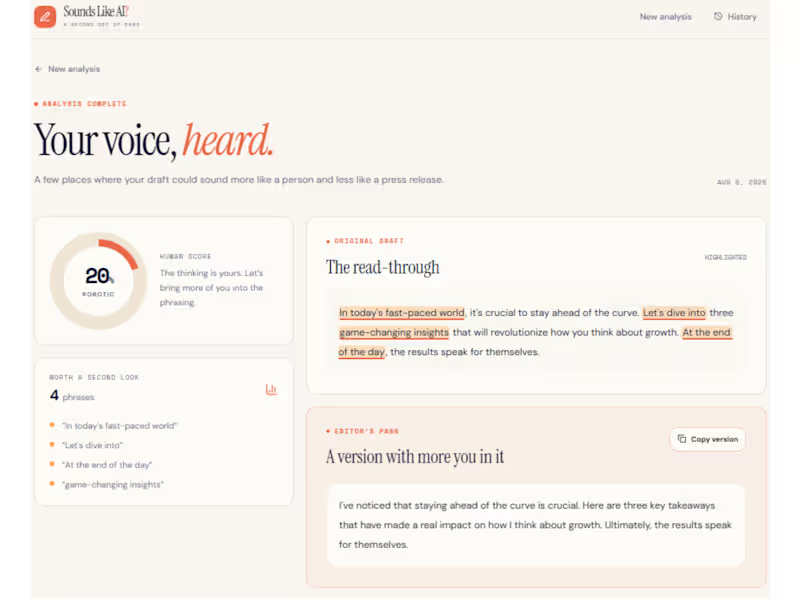
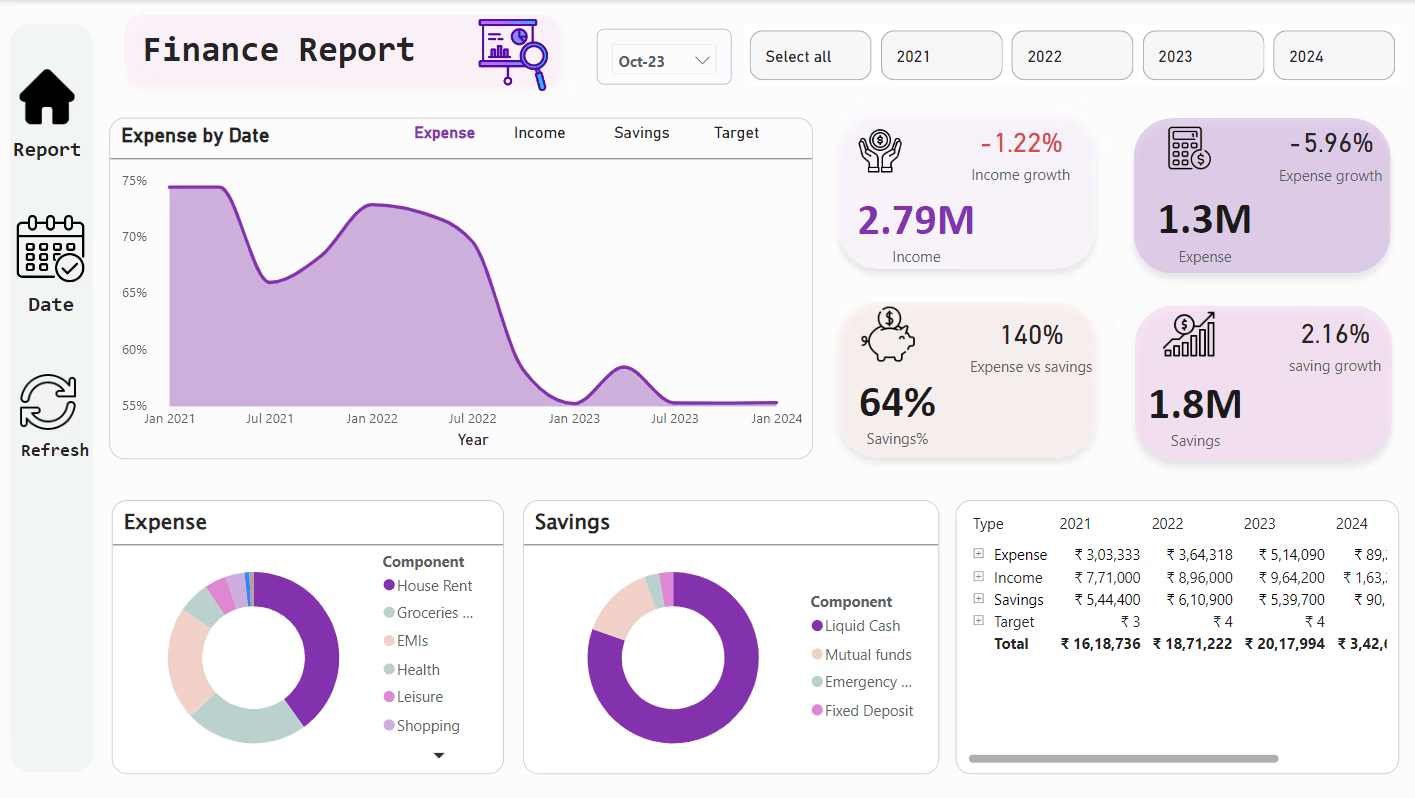
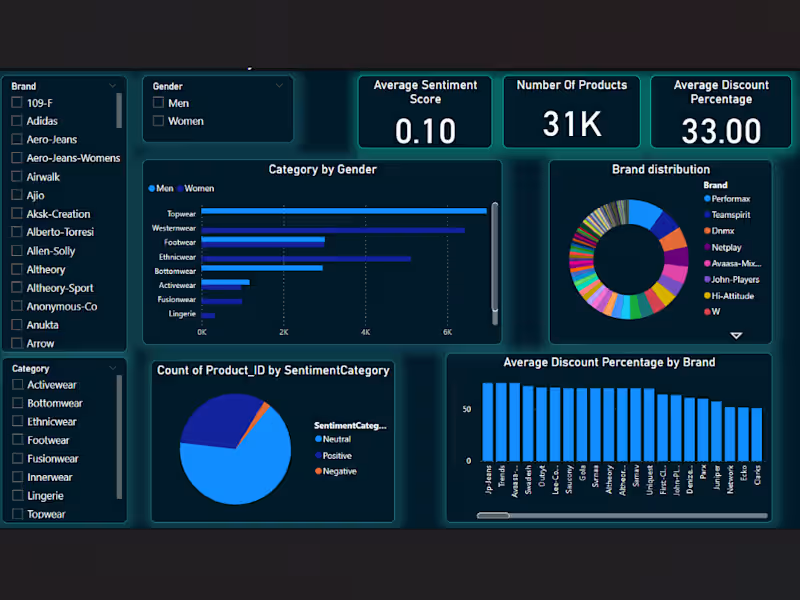
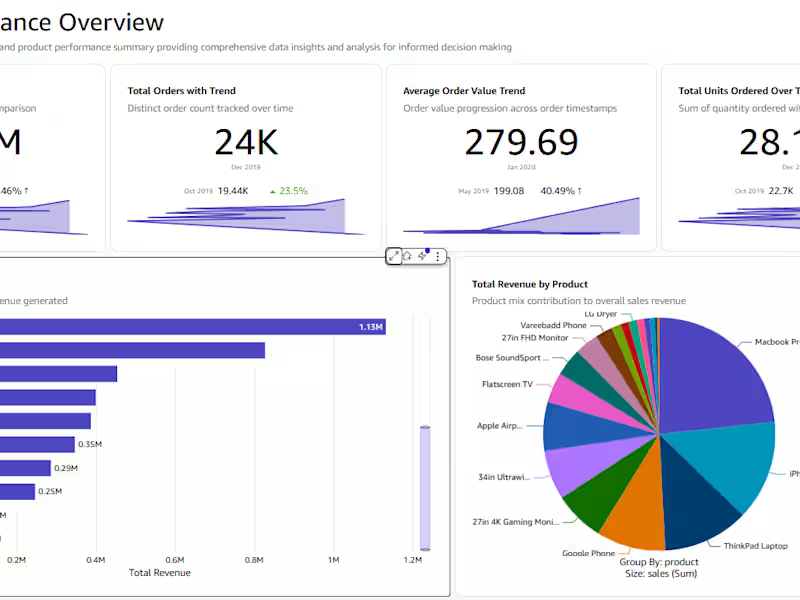
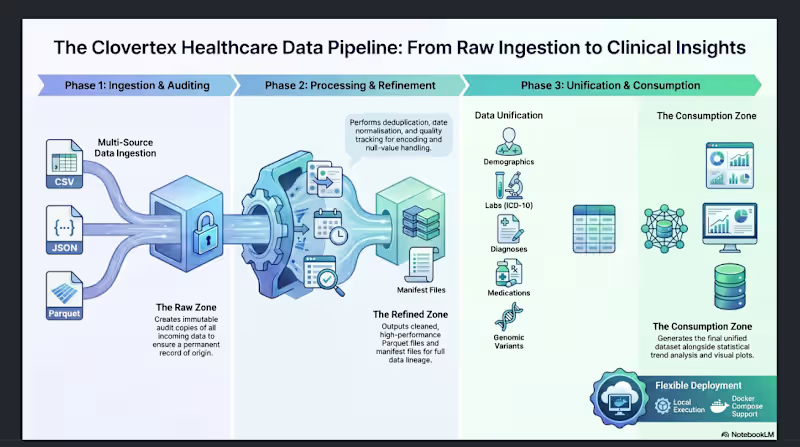
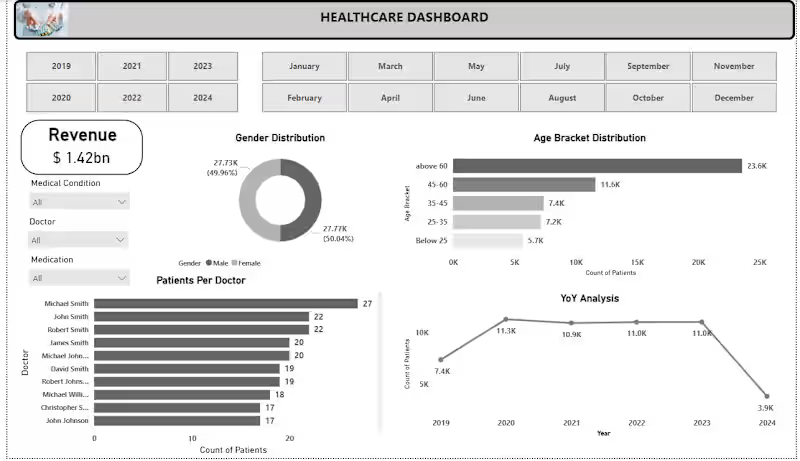
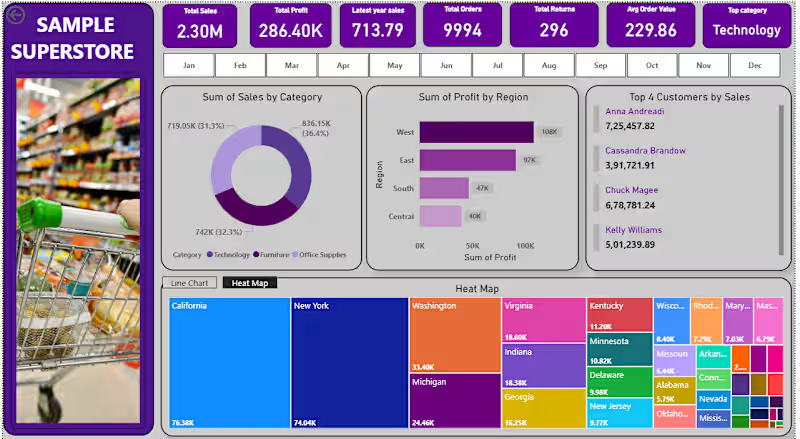
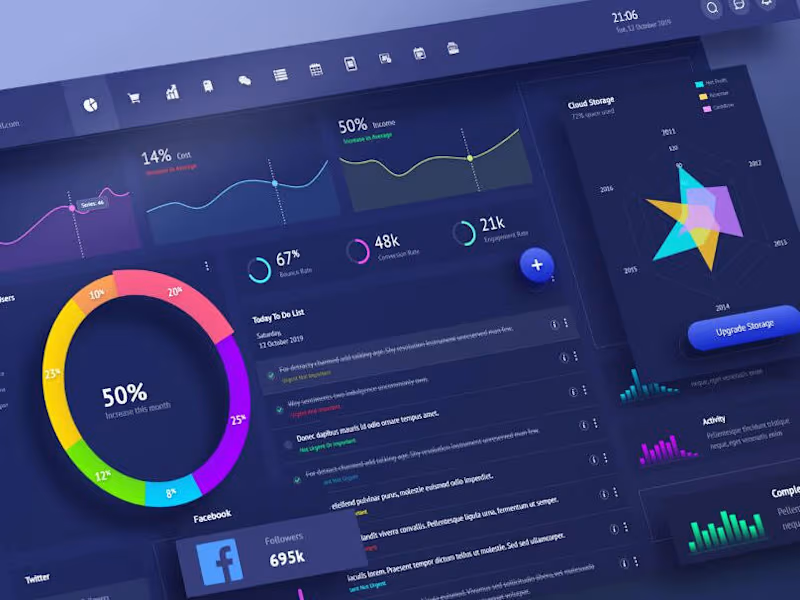
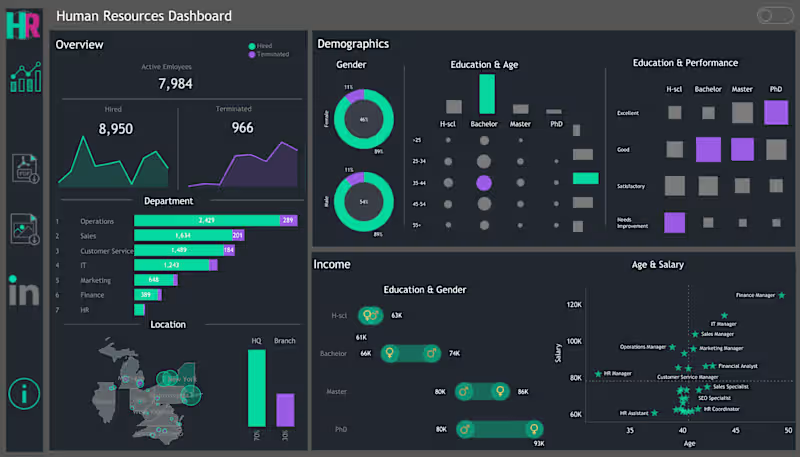
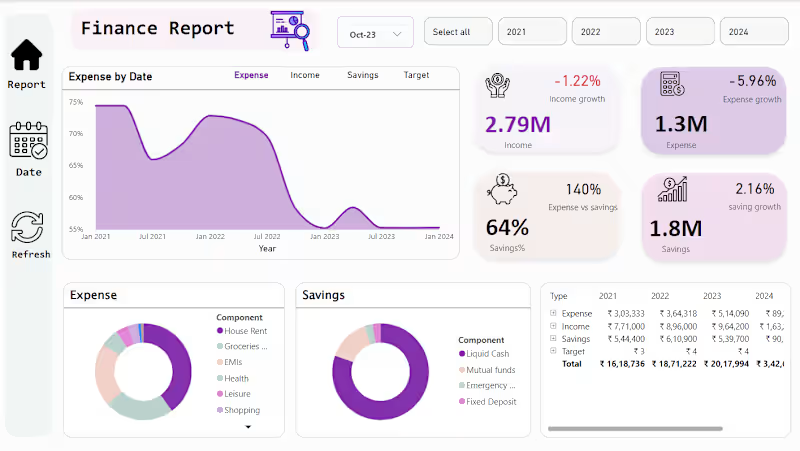
Project Overview This is a personal portfolio and services site built for a working freelancer β€” myself β€” as part of the Make It Real Challenge. I'm a data visualization specialist and AI dashboard developer, and I wanted the site itself to reflect that work rather than just describe it. So instead of stock photography and generic copy, every visual on the site is a real screenshot from a project I've actually shipped. The Concept Most freelance portfolio sites lean on polished lifestyle photography β€” laptops on wooden desks, people in blazers looking thoughtfully at monitors. I wanted to flip that: let the actual product screens do the talking. The site is built around a simple idea β€” "solutions built on data, not guesswork" β€” and that shows up literally in the visuals, not just the copy. What's on the site Homepage: A direct hero statement ("I Turn Messy Data Into Decisions") backed immediately by a real dashboard screenshot from my Anomaly Review & Action Console, followed by a "recent work" section pulling in three separate real projects. Services page: Four core offerings β€” Anomaly Detection Dashboards, Power BI & Data Analytics, AI-Integrated Internal Tools, and Custom Data Automation β€” each paired with an actual screenshot of that specific project (not a mockup). About page: A short, direct bio and a real photo, no filler. Contact page: A simple inquiry form paired with a data-visualization graphic that matches the site's overall theme. How I used Finish Layer Block Animations: I used on-appear and on-scroll triggers (Reveal and Slide styles) across the homepage, services, and contact pages. Section headings reveal as the page loads, and content blocks slide/fade in as the visitor scrolls β€” this turns what would be a static, all-at-once page into a guided, paced experience. Block Transform: Rather than a flat grid, I applied a subtle rotation to a couple of key visuals (a dashboard screenshot and the contact-page graphic) β€” just a few degrees, enough to break the rigidity of the layout without sacrificing readability. It gives the page an asymmetrical, more intentional feel instead of looking templated. Process I built this using Squarespace's Blueprint AI to get a fast base structure, then went through every page replacing AI-generated placeholder content (stock imagery, generic service descriptions, an accidental product/ecommerce section) with real project data, real screenshots, and copy that actually reflects how I work with clients. The site is password-protected rather than published on a paid plan, and is fully responsive across desktop and mobile. Access: πŸ”— Site: https://pike-megalodon-4yb2.squarespace.com (https://pike-megalodon-4yb2.squarespace.com)πŸ”‘ Password: Omega
2
186
Merging insights with storytelling
"From Data Chaos to Business Clarity."
Data Guru: Visualize, Analyze, Clean

Driving operational excellence with advanced data solutions.

🧬 Merging Life & Data Science for Unique Insights