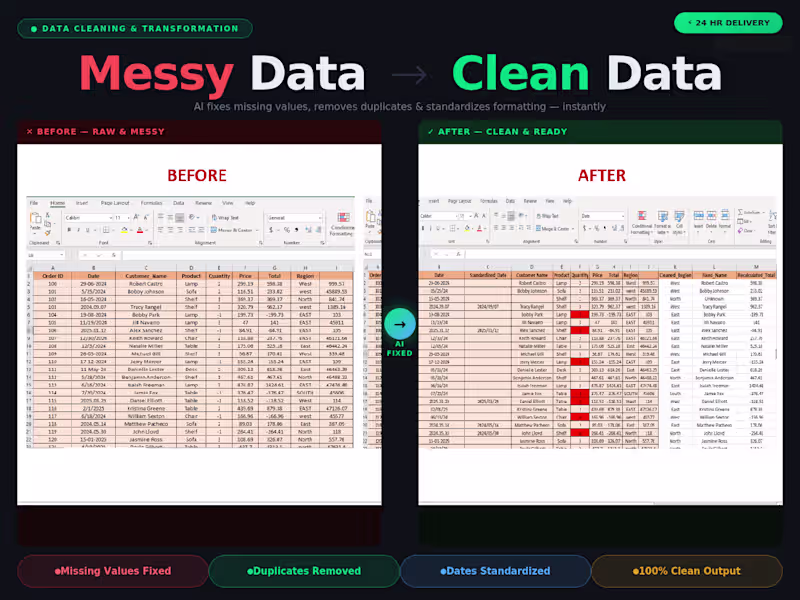
Projects using Microsoft Excel in MaharashtraProjects using Microsoft Excel in MaharashtraI specialize in data cleaning and preprocessing, ensuring your spreadsheets or databases are accurate, well-formatted, and ready for analysis or reporting.
What Ill do for you:
Remove duplicates, nulls, and inconsistencies
Standardize date, text, and numeric formats
Fix spelling/case issues
Split/merge columns (e.g., names, addresses)
Convert file formats (CSV Excel SQL)
Python or SQL-based advanced cleaning (if required)
Supported formats: Excel, CSV, Google Sheets, SQL dumps
Clean, fast & confidential service
100% satisfaction guaranteed
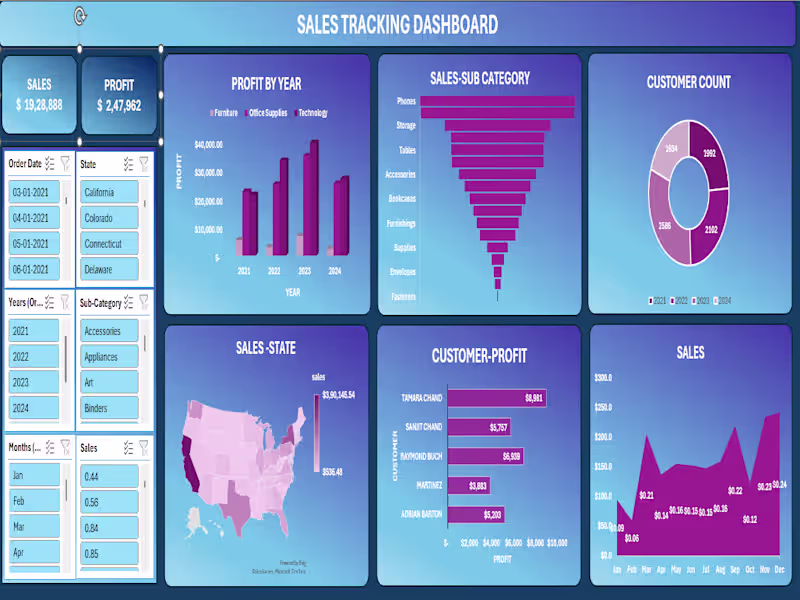
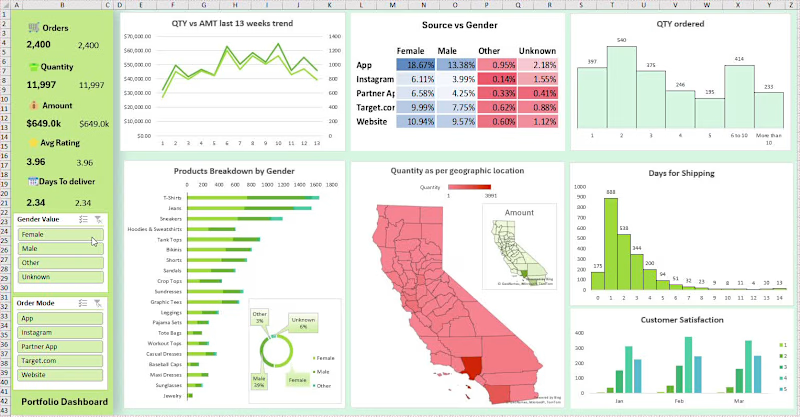
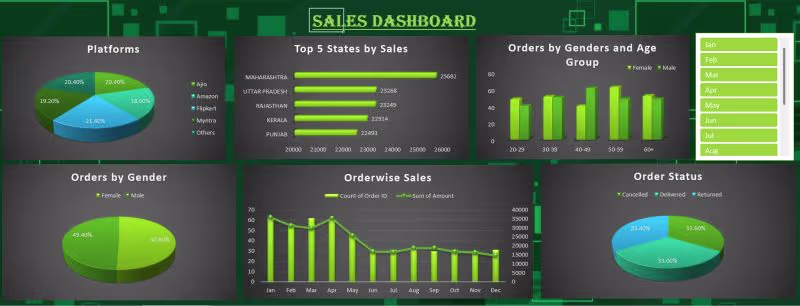
Message me before ordering so I can understand your dataset and goals! 📊 Sales Tracking Dashboard | Excel + Power BI Project
Built an end-to-end interactive Sales Tracking Dashboard covering 2021–2024 across the entire US market.
Top-Line Numbers:
💰 Total Sales: $19,28,888
📈 Total Profit: $2,47,962
👥 Total Customers: 8,314 across all years
What the dashboard reveals:
🏆 Best-selling sub-categories: Phones ($2,79,464) and Chairs ($2,77,058) lead the pack — together accounting for nearly 29% of all sales
📅 Profit growth year-on-year:
→ 2021: $49,556 → 2022: $61,618 → 2023: $81,786 — consistent upward trajectory across Furniture, Office Supplies & Technology
🗺️ Geographic concentration: California dominates at $3,90,145 in sales. New York ($2,46,517) and Texas ($1,51,436) follow. West Virginia sits at the bottom with just $536 — a clear signal for regional strategy review.
📦 Technology drives profit — highest-margin category across all 4 years, despite Furniture holding significant volume
🧾 Seasonal trends: Q4 is king — November ($2,34,013) and December ($2,41,464) are the strongest months. February dips to just $59,640 — opportunity for targeted campaigns.
👤 Top customer by profit: Tamara Chand at $8,981, followed by Raymond Buch ($6,939) and Sanjit Chand ($5,757)
Tools used: Microsoft Excel · Pivot Tables · Power Query · Charts & Slicers · Dashboard Design
This project sharpened my ability to turn raw transactional data into a clean, decision-ready visual — with filters for state, date, year, sub-category, and month.
Open to feedback! 👇
#Excel #DataAnalytics #SalesDashboard #DataVisualization #BusinessIntelligence #MicrosoftExcel #DashboardDesign