
About
LeEco
LeEco was building towards a connected technology and entertainment ecosystem, with India as an important market in that expansion. Its proposition brought technology, content and connected experiences together across smartphones, entertainment and television.
I worked closely with the LeEco India team across multiple technology launches, helping translate that larger ecosystem into content and consumer experiences for the Indian market.
0
12

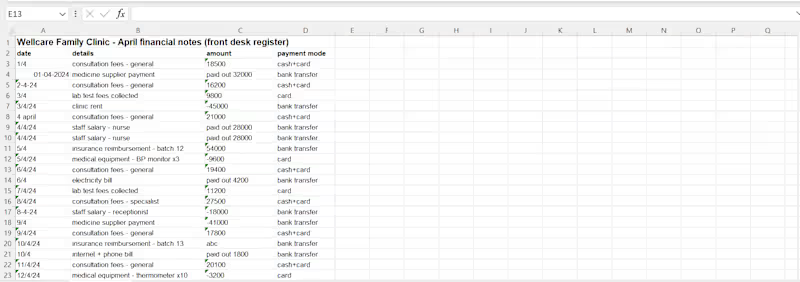
Hello guys, I am Bharat professional Bookkeeper where I take data from the client clean it and give the proper consistent and Structured Data
Today I had Data of WellCare Health Clinic where I get the Messy and Inconsistent data of the clinic which I had fixed the problem
What was the problem:
1.Was it Structured ❌
2.Is (http://2.Is) the data provided Consistent and Not Broken ❌
3.Is (http://3.Is) the data easily Recognisable by looking at it (like can we Identify it is expense, Utilities or Income ❌
4.Is (http://4.Is) it maintained in proper format ❌
How I fixed it using Excel:
1.First, I categorize the data properly in a Structure ✅
2.Then I put the data into proper format (Like 1/4/24 to 01-04-2024) ✅
3.I just take out the Inconsistent, Broken and duplicate data into Consistent data ✅
4.I made data easily Recognisable by looking it (Like We can easily identify expense utility and income by highlighting them. ✅
Left one is the messy and Inconsistent data and right one is Proper structured and Consistent Data
If you are someone looking for Bookkeeping service, I will do it with proper analysis and with a proper disciplined structure.
Thank you
#Bookkeeping (https://www.linkedin.com/search/results/all/?keywords=%23bookkeeping&origin=HASH_TAG_FROM_FEED) #Dataentry (https://www.linkedin.com/search/results/all/?keywords=%23dataentry&origin=HASH_TAG_FROM_FEED) #India (https://www.linkedin.com/search/results/all/?keywords=%23india&origin=HASH_TAG_FROM_FEED) #USA (https://www.linkedin.com/search/results/all/?keywords=%23usa&origin=HASH_TAG_FROM_FEED) #Datacleaning (https://www.linkedin.com/search/results/all/?keywords=%23datacleaning&origin=HASH_TAG_FROM_FEED) #Australia (https://www.linkedin.com/search/results/all/?keywords=%23australia&origin=HASH_TAG_FROM_FEED) #UAE (https://www.linkedin.com/search/results/all/?keywords=%23uae&origin=HASH_TAG_FROM_FEED)
1
132
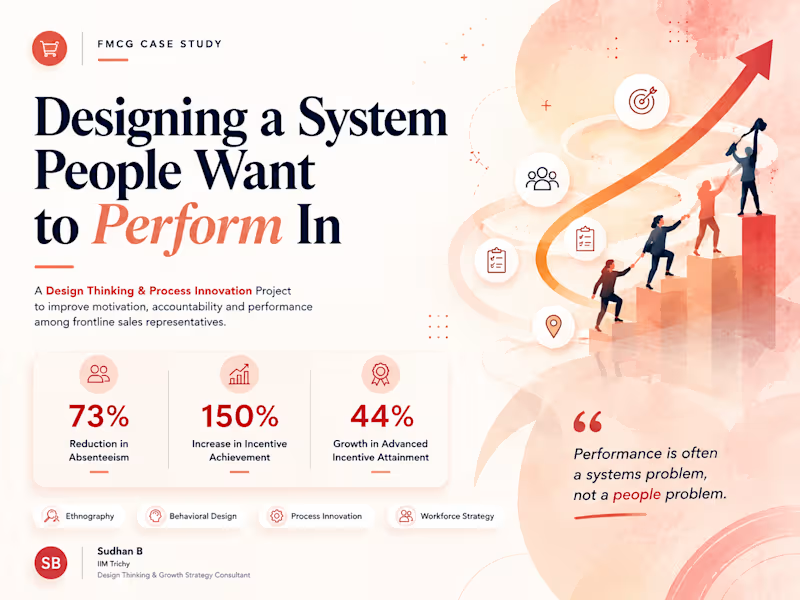
A 73% reduction in absenteeism without increasing salaries.
Sounds unlikely.:
But after observing frontline FMCG sales representatives for two months, the real issue became clear:
The problem wasn't the people.:
It was the system they worked in.:
This case study shows how ethnography, behavioral design and process innovation transformed motivation, accountability and performance at the ground level.🚀
1
264

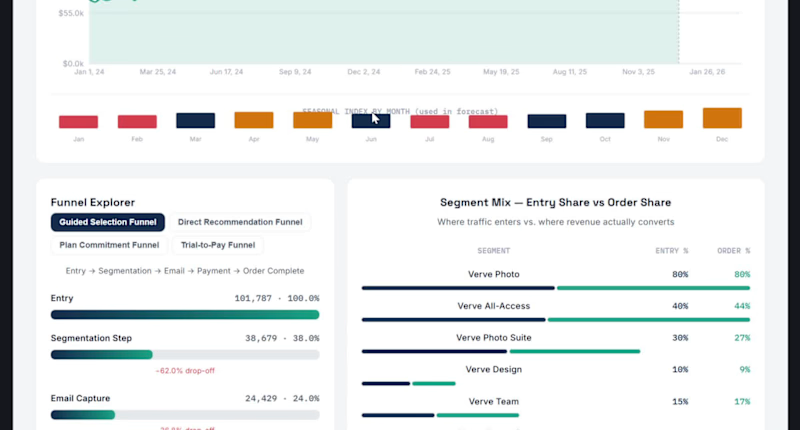
Skip the License Fee: I Built a Full Dashboard with Just JS
Verve Pulse: Revenue & Funnel Intelligence Dashboard
Most analysts stop at Power BI or Tableau. I wanted to go a layer deeper by building a fully custom dashboard in React to show what's possible when a BI tool's templates don't box you in.
Off-the-shelf visualization tools are great, but they come with real limits: fixed chart types, licensing costs, and UX you can't fully control. With JavaScript, I designed and built Verve Pulse from a blank canvas. Total control over layout, interactivity, and how the story of the data actually reads to stakeholders, and deployed it for free on Vercel, with no licensing cost and no vendor lock-in.
The dashboard unifies what's usually three separate reports - current performance, historical trend, and forecast as a single filterable view, with dedicated explorer views for 4 purchase funnels, 4 customer segments, and regional performance, plus a seasonality-adjusted forecast that shows its own assumptions instead of acting like a black box.
What I did:
Designed the full filter and data framework from a wireframe spec
Built a seasonality-adjusted forecasting model (trend decomposition + monthly seasonal indexing)
Designed and built the interactive dashboard end-to-end in React.
Deployed it as a free, live, secure product on Vercel
Why it matters: custom-coded dashboards trade a steeper learning curve for full design freedom, zero licensing cost, and infrastructure you fully control - a combination most Power BI/Tableau builds can't offer.
Skills & tools: Data analysis & forecasting · Dashboard/product design · React & Recharts · Git/GitHub · Vercel deployment
🔗 Code: https://github.com/SrijaaBizAnalyst/Revenue-Analytics-Dashboard-for-Verve-Studio
1
120
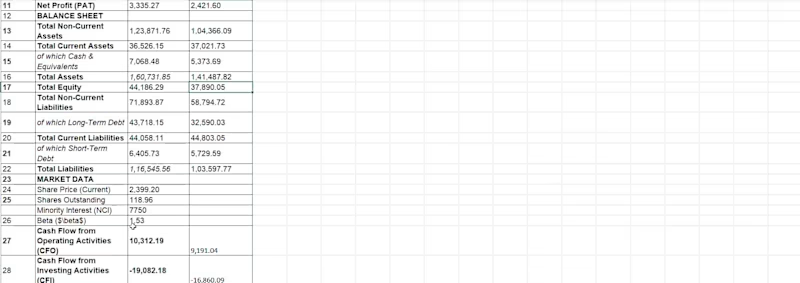
Role: Financial Analyst
Description: Created a comprehensive Discounted Cash Flow (DCF) and ratio analysis model to contrast the financial health of two distinct business models (Adani vs. CBRE). This involved detailed valuation, sensitivity analysis, and strategic forecasting.
Tools: Advanced Excel, Bloomberg Terminal, Financial Modeling.
Impact: Delivered a structured comparison used for strategic investment recommendations.
0
50
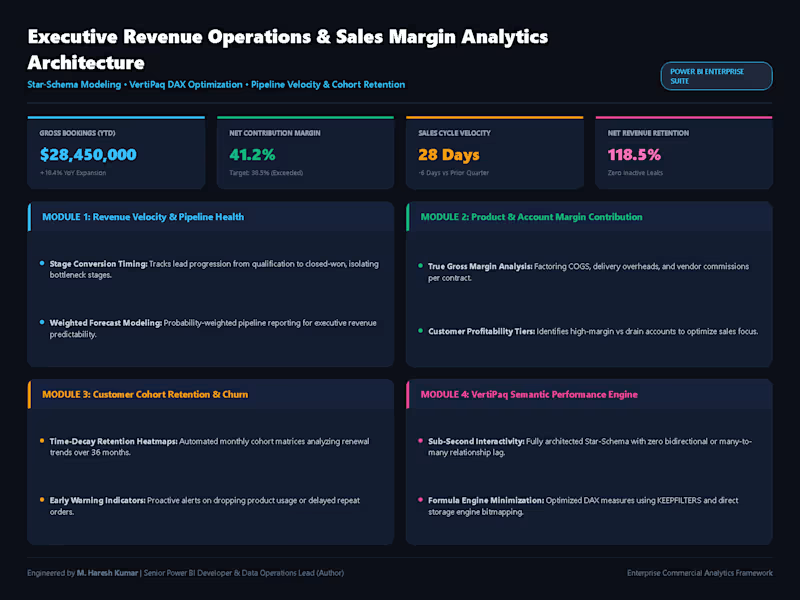
Executive revenue operations dashboard tracking sales velocity, conversion cycle times, and product-level gross margin contribution. Implements pure star-schema semantic data modeling and VertiPaq-optimized DAX measures for instant sub-second filtering across multi-year historical datasets. Includes automated customer cohort retention tracking and pipeline leak diagnostics.
0
27

Developed clear and audit-ready process documentation, including process narratives, flowcharts, SOPs and Risk Control Matrices (RCMs). Simplified complex business processes into structured documentation that improved operational clarity, standardization and supported audit and compliance requirements.
0
44

Board-Level Strategy Review Deck — Real Estate Firm (Board Level Presentation)
Project Overview
Beyond Consulting partnered with a leading enterprise real estate firm to design a board-level strategy review deck that translated a full year of performance data and a 3-year growth roadmap into a clear, decision-ready narrative for senior leadership.
0
124


Excel Data Cleaning & Formatting (Before / After) : Transformed an unorganized, messy employee list into a clean, structured, and professionally formatted database. Standardized names, corrected missing fields, applied clean date formats, and added drop-down filters for seamless data management and report readability.
0
76


