Data Analysis Projects in Kanpur
Data Analysis Projects in Kanpur
Sign Up
Post a job
Sign Up
Log In
Filters
2
Projects
People
Message
4
Alok Tripathi
Looking for a professional Power BI dashboard that delivers real insights, not just charts? I will design clean, interactive, and executive-level Power BI dashboards that help you analyze data, track KPIs, and make better decisions. What I offer: Professional Power BI dashboards & reports Single-page or multi-page dashboards KPIs, charts, and interactive slicers DAX measures & calculations Conditional formatting and drill-down analysis Export-ready tables and reports Clean and business-friendly design Tools & Skills: Microsoft Power BI DAX Power Query Data modeling Ideal for: Business & sales dashboards KPI and performance reporting Government or public data analysis Academic and portfolio projects You will receive the .pbix Power BI file and full guidance if needed.
4
84
Message
3
Shivendra Singh Bhadauriya
Every business constantly monitors its numbers. One department that relies on them the most is the Marketing / Ads Tracking team. Marketing teams usually track performance across multiple platforms like Google Ads, Facebook Ads, Meta, and other channels. The challenge is that the data is often scattered, making it difficult to quickly understand overall performance. Great dashboards don’t just show data — they help businesses make smarter decisions faster. If your business is looking to build powerful Power BI dashboards for marketing, sales, or business analytics, feel free to connect with me. 📩 Open to Power BI projects #PowerBI #DataAnalytics #MarketingAnalytics #BusinessIntelligence #DashboardDesign
3
92
Message
0
Raushan Lal singh
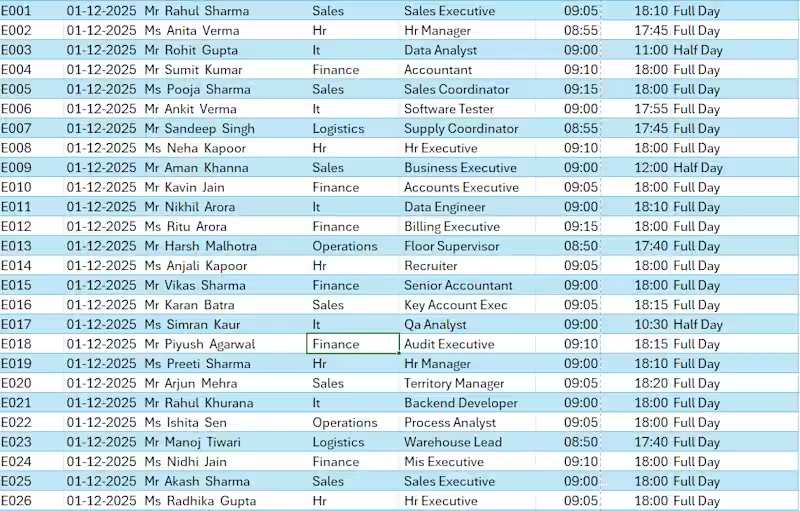
Details of Employees of XYZ company
0
16
Message
6
Alok Tripathi
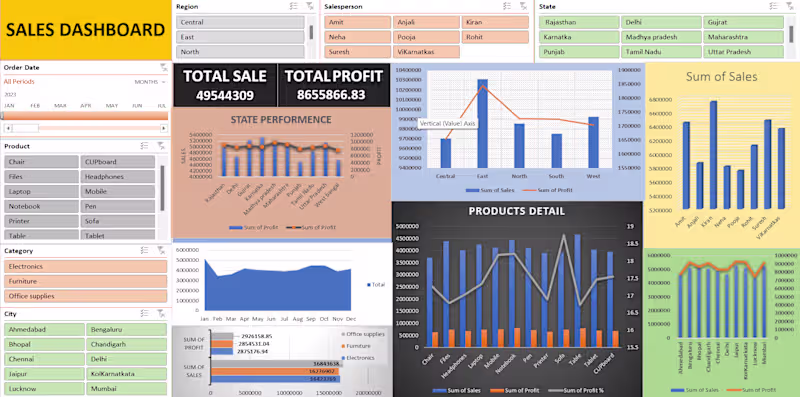
I will create professional Excel dashboards using your data to analyze sales, profit, performance, and trends. My dashboards are clean, easy to use, and designed for real business needs. What I offer: Excel dashboards with charts and visuals Pivot tables and data analysis Interactive slicers and filters Sales, profit, and performance tracking Clean and organized data layout Why choose me: Accurate and clear analysis Fast delivery Easy communication Revisions until satisfaction (as per package) Use cases: Sales & revenue analysis Business performance dashboards Product & region-wise reports Monthly or yearly reporting Please message me before placing an order to discuss your data and requirements.
4
6
98
Message
0
Shivendra Singh Bhadauriya
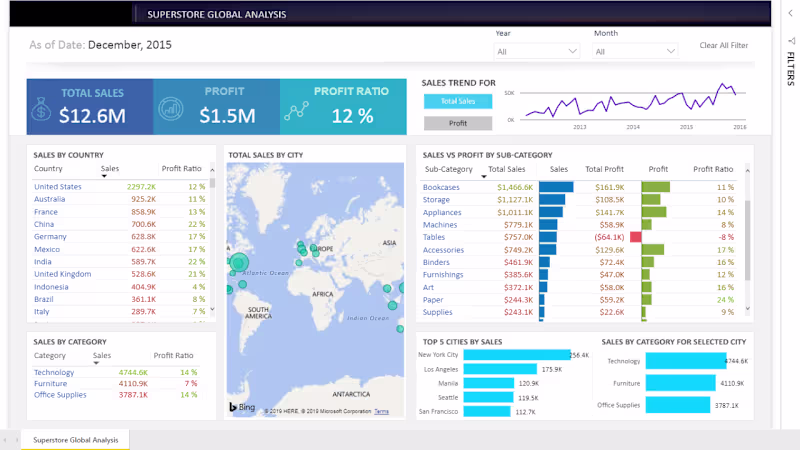
Power BI Superstore Global Sales Dashboard providing a worldwide view of sales and profitability. Features KPI cards (Sales $12.6M, Profit $1.5M, Ratio 12%), global sales map, country and city performance, sales trends, and sub-category profit analysis to identify top markets and growth opportunities.
0
33
Message
0
Raushan Lal singh
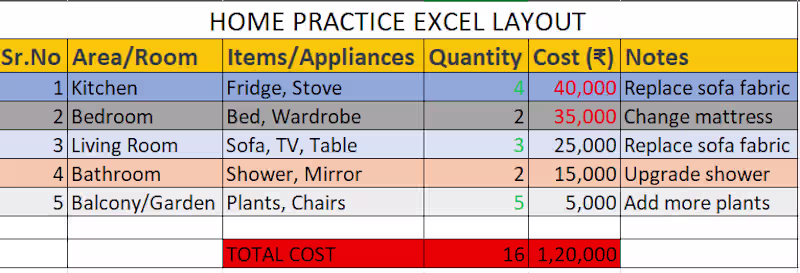
Home Pricing with home details and Cost,
0
22
Message
3
Alok Tripathi
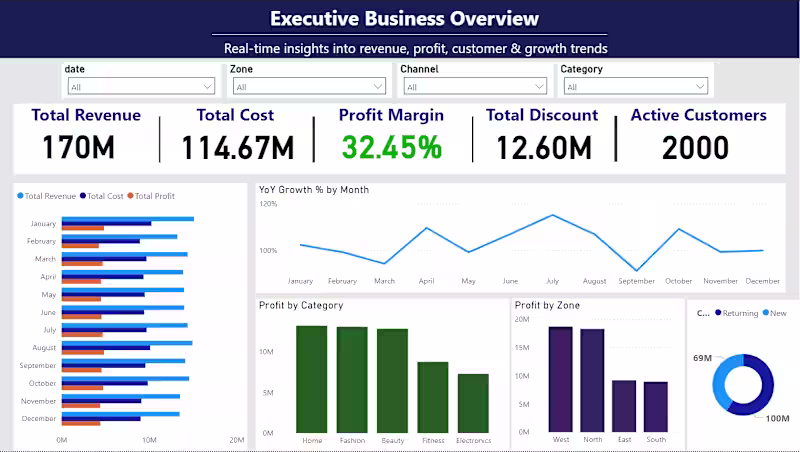
Title Executive Business Performance Dashboard (Power BI) Description I designed an Executive-level Business Intelligence Dashboard in Power BI that delivers real-time insights into revenue, profitability, customer behavior, and growth trends. This dashboard is built for founders, managers, and decision-makers who need clarity—not clutter. What This Dashboard Solves Understand revenue, cost, and profit margin at a glance Track YoY growth trends and monthly performance Identify top-performing categories, regions, and channels Analyze active customers, AOV, and customer profitability Compare new vs returning customers Enable data-driven executive decisions you need a custom Power BI dashboard tailored to your business, let’s connect.
4
3
78
Message
0
Shivendra Singh Bhadauriya
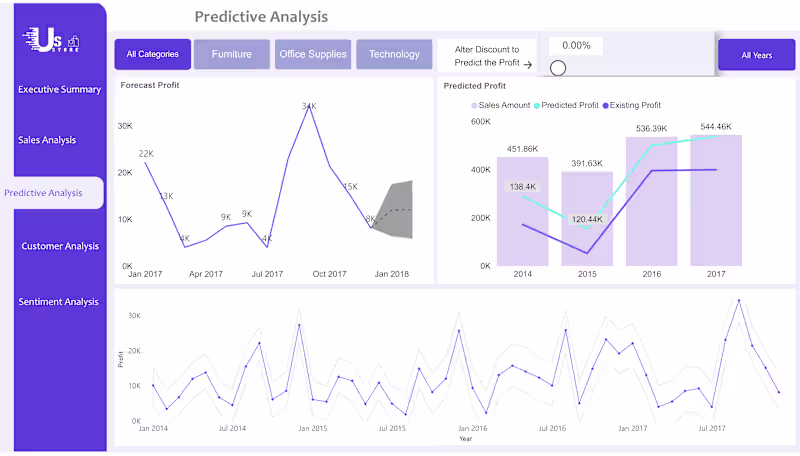
Power BI Predictive Analysis Dashboard enabling profit forecasting and scenario analysis. Includes profit forecast trends, predicted vs existing profit comparison, and a dynamic discount slider to simulate pricing impact on profit. Helps businesses evaluate strategies and anticipate future performance
0
33
Message
0
Raushan Lal singh
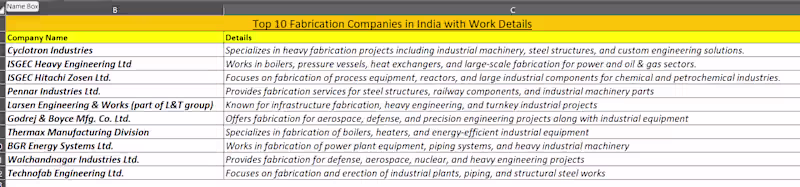
Top 10 Fabrication Companies in India With Work details.
0
34
Message
2
Alok Tripathi
Data Analytics dashboards using Excel & Power BI. I focus on cleaning raw data, creating clear visualizations, and delivering insights that help clients understand performance and make better decisions. #DataAnalytics #PowerBI #Excel #Dashboards
1
2
51
Message
0
Shivendra Singh Bhadauriya
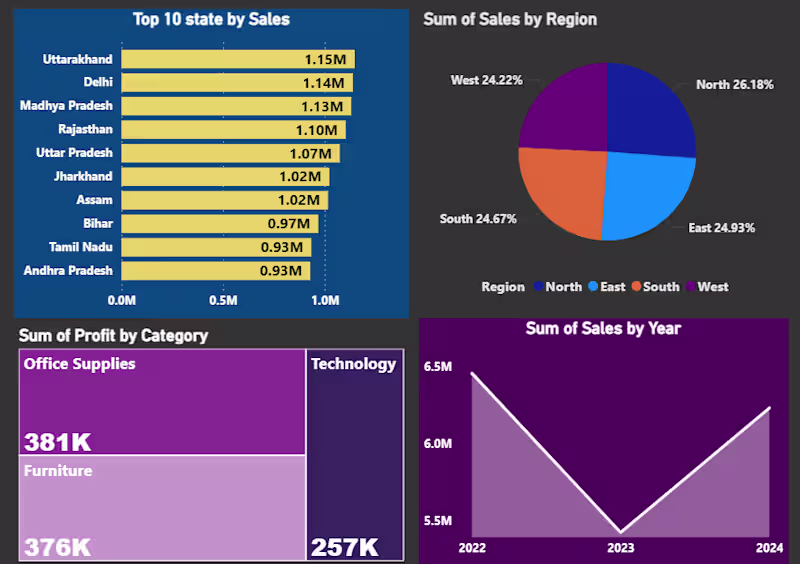
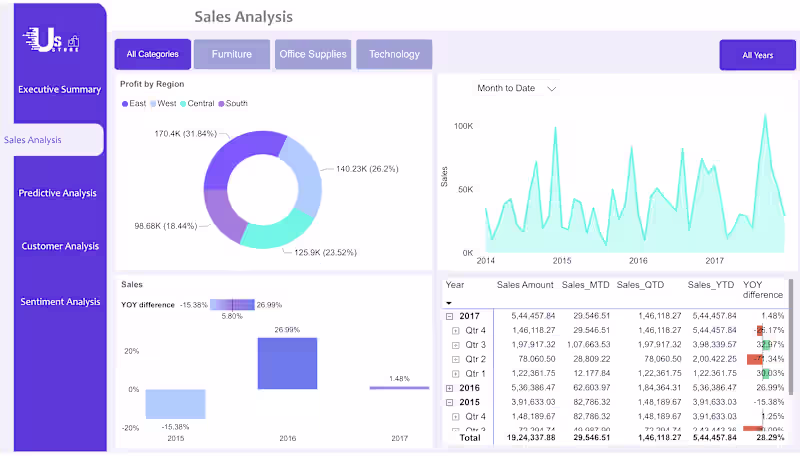
Power BI Sales Analysis Dashboard showing regional profit distribution, monthly sales trends, and YoY growth. Features category slicers, profit-by-region donut chart, sales trend analysis, and yearly performance metrics (MTD, QTD, YTD) to help executives quickly track sales performance and regional profitability.
0
38
Message
0
Raushan Lal singh
Employees Detailed
0
48
Message
0
Shivendra Singh Bhadauriya
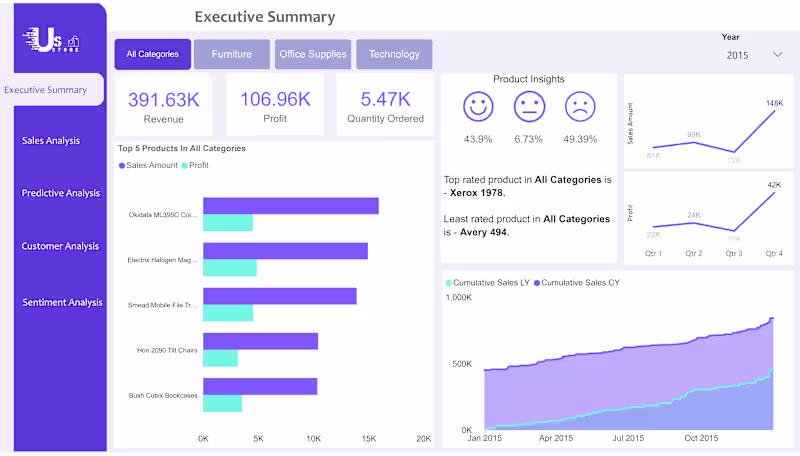
Built a multi-page Power BI Retail Executive Sales Dashboard to track revenue, profit, and product performance in real time. Includes KPI summary (Revenue 391K, Profit 106K, Qty 5.47K), category slicers, top product sales vs profit, sentiment insights, quarterly trends, and YoY cumulative sales for faster decisions.
0
30
Explore projects