The network for creativity
Join 1.25M professional creatives like you
Connect with clients, get discovered, and run your business 100% commission-free
Creatives on Contra have earned over $150M and we are just getting started
Back to feedPost
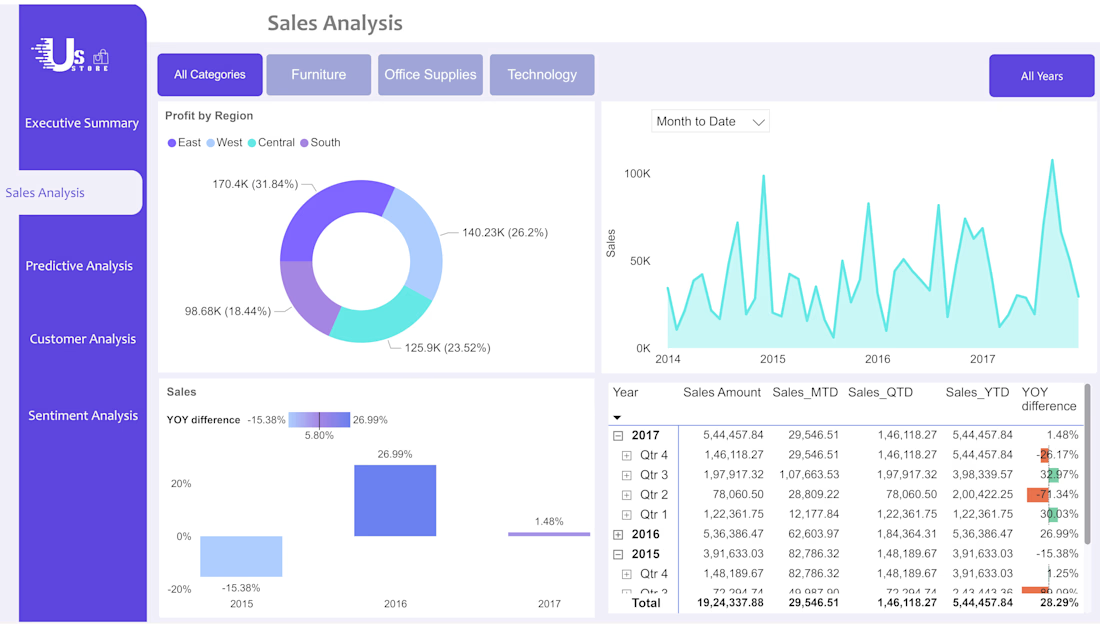
Power BI Sales Analysis Dashboard showing regional profit distribution, monthly sales trends, and YoY growth. Features category slicers, profit-by-region donut chart, sales trend analysis, and yearly performance metrics (MTD, QTD, YTD) to help executives quickly track sales performance and regional profitability.
The network for creativity
Join 1.25M professional creatives like you
Connect with clients, get discovered, and run your business 100% commission-free
Creatives on Contra have earned over $150M and we are just getting started
Related posts
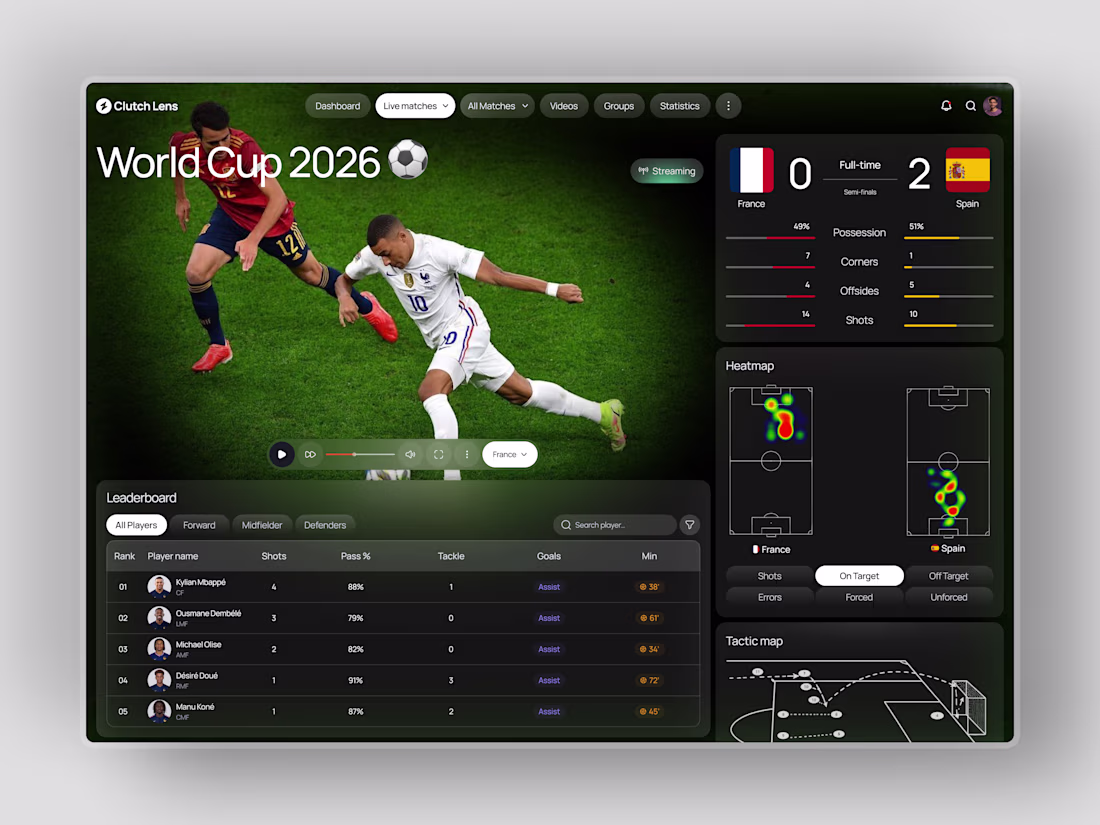
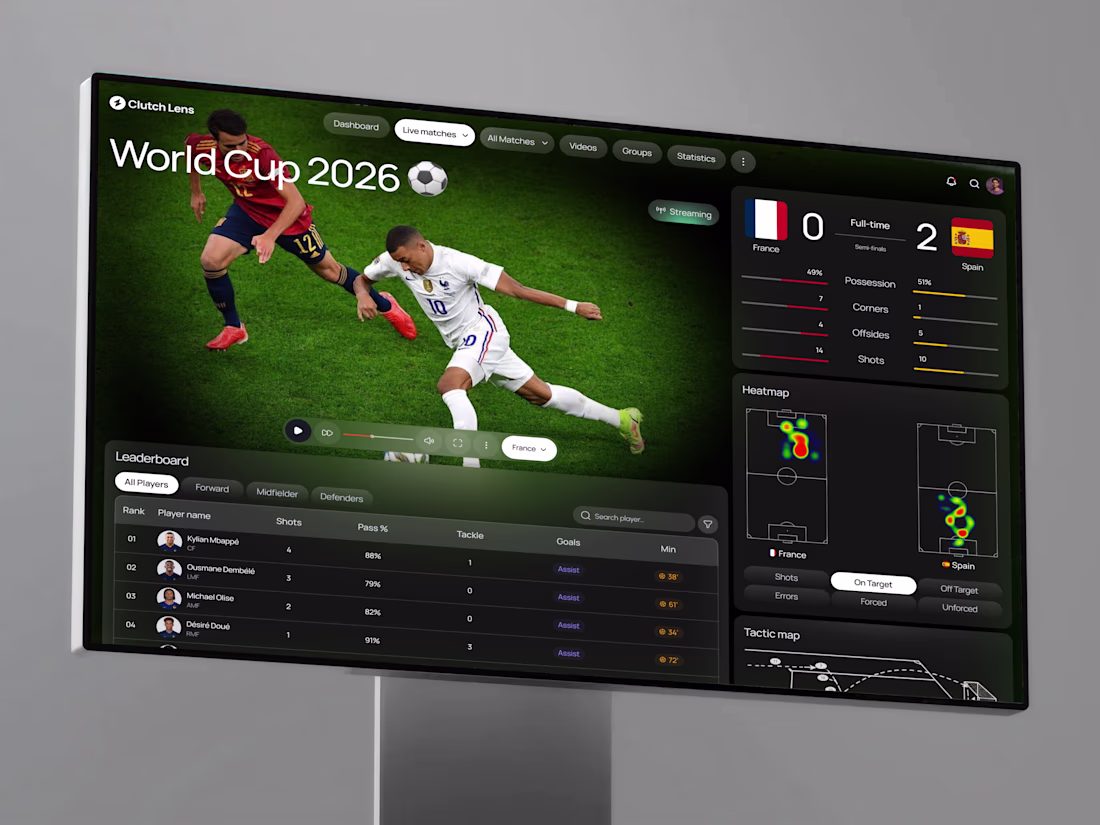
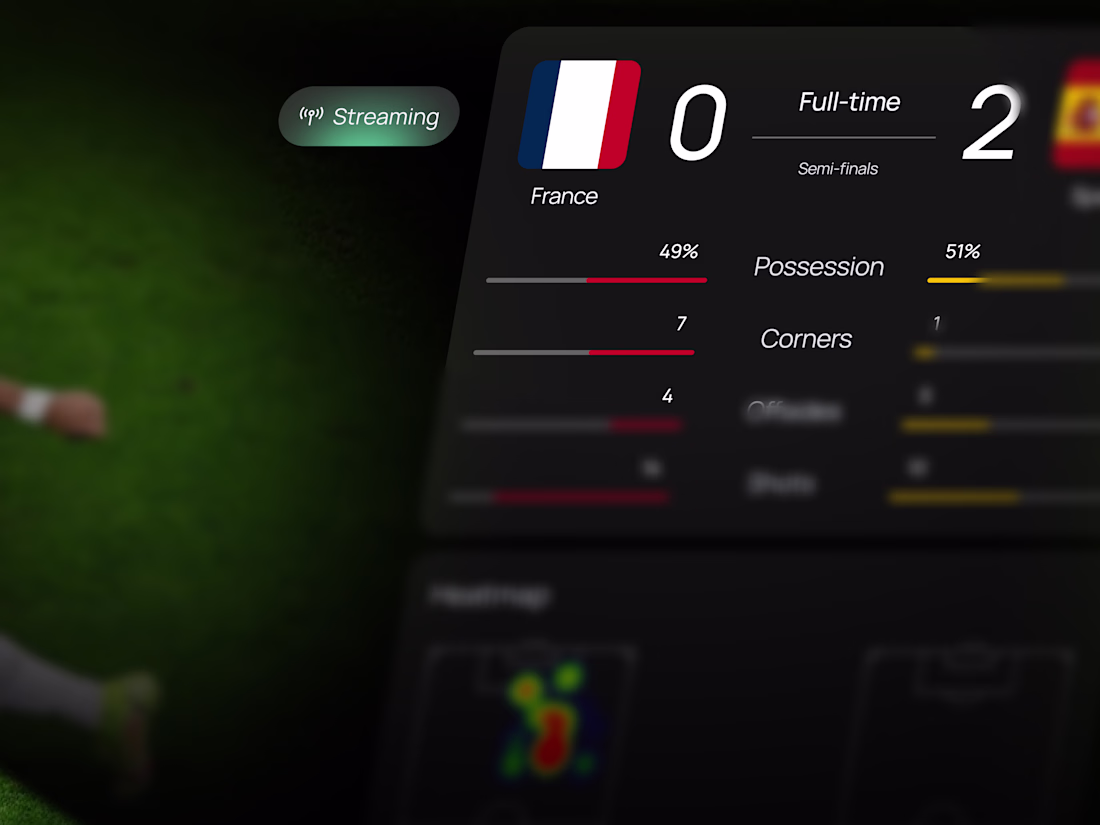
Live football data has always existed. A dashboard that makes it feel this immediate hasn't.
Clutch Lens brings the entire match into one screen: live streaming, real-time scoreboard, possession and shot stats, dual team heatmaps, player leaderboard, and a tactic map that shows exactly how the game is being played, not just who's winning it.
France 0 VS Spain 2. Semi-finals. World Cup 2026. Every number that matters, right where it should be.
Dark. Live. Built for the football obsessed.
Designing a sports analytics platform that needs to feel this considered? Let's build it together.
Tools: Figma
#SportsUI #DashboardDesign #FIFA2026 #WorldCup2026 #UIDesign #DarkUI #ContraFreelance
Amazing design
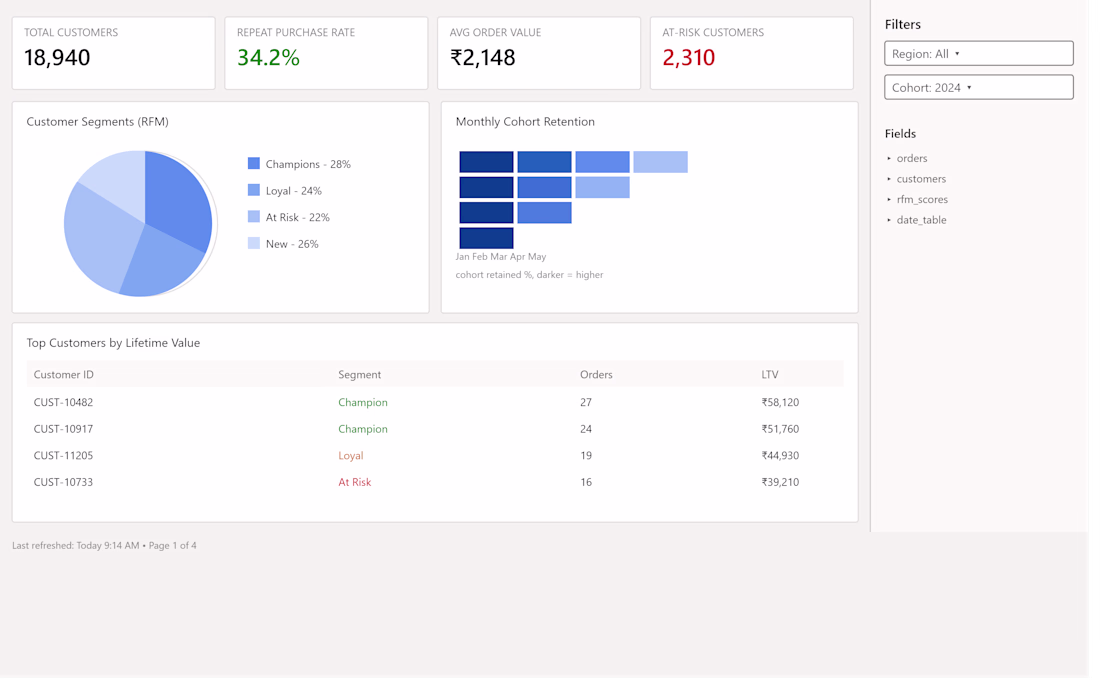
Built this one for an e-commerce customer behavior project - 18,000+ customers, segmented using RFM (Recency, Frequency, Monetary) analysis.
The interesting part wasn't the segmentation itself, it was what it revealed: nearly 22% of customers were "at risk" of churning, and most businesses wouldn't know that until those customers had already stopped buying.
This is the kind of insight that's usually sitting in your order data already, it just needs the right lens. Happy to take a look at your numbers if you're curious what's hiding in yours.
Tools used: Power BI, SQL, Python (Pandas, Scikit-learn for clustering)
Spreadsheets work... until they don't.
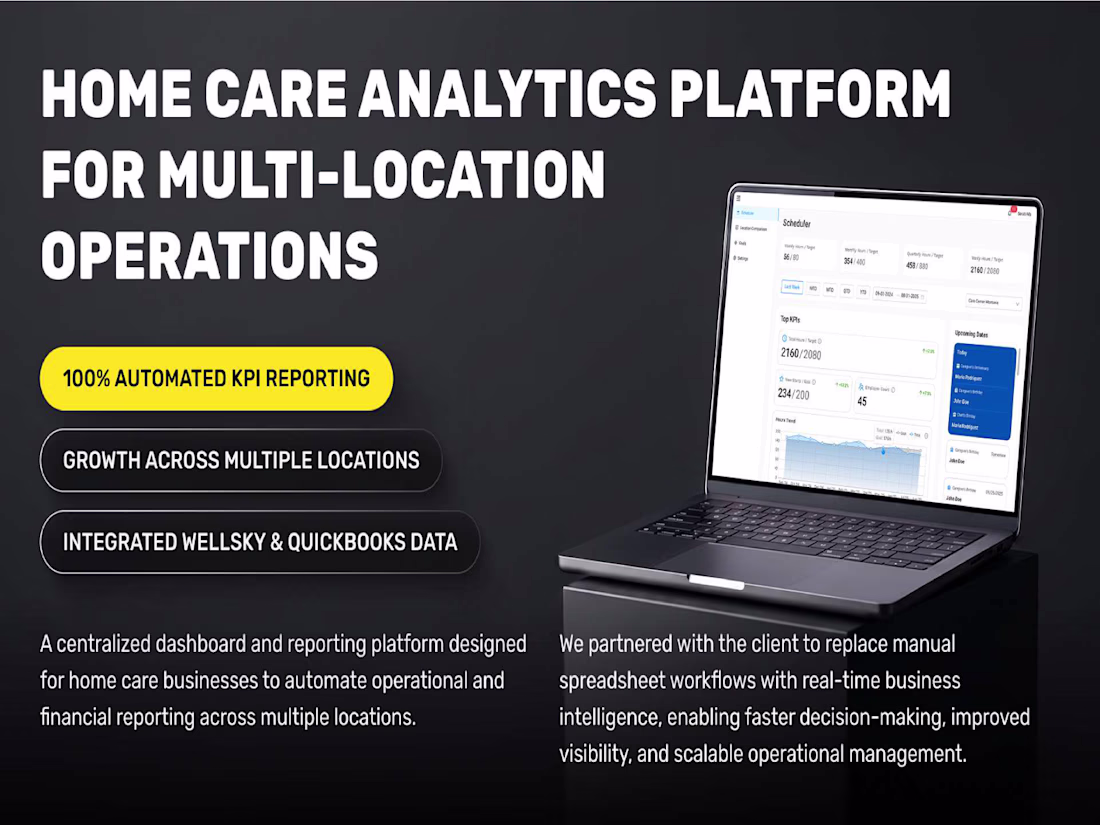
For this project, we helped a home care organization replace manual reporting with a centralized BI platform that automatically tracks operational and financial performance across multiple locations.
Real-time dashboards, KPI reporting, role-based access and integrations with WellSky and QuickBooks - all in one place.
Sometimes the biggest productivity boost isn't adding new features. It's making the right data easy to understand. 📊
Home care is a sharp choice because the pain is not the reporting, it is the audit trail when a regulator or family asks what happened and when. Replacing spreadsheets is the easy win, the real value is that every entry is now timestamped and defensible. Did you build in an immutable log, or is it still editable after the fact?
Trending
Claude
Claude has entered the design space. How are you using Claude Design?
Contra University
Learn from expert creatives how to earn more using next-gen AI tools.
creativeaiflow
Creative AI workflows are evolving. What tools do you use, and what are their strengths and weaknesses?
freelancerlife
Freelancer life is wins, pivots, and everything in between. What’s yours right now?