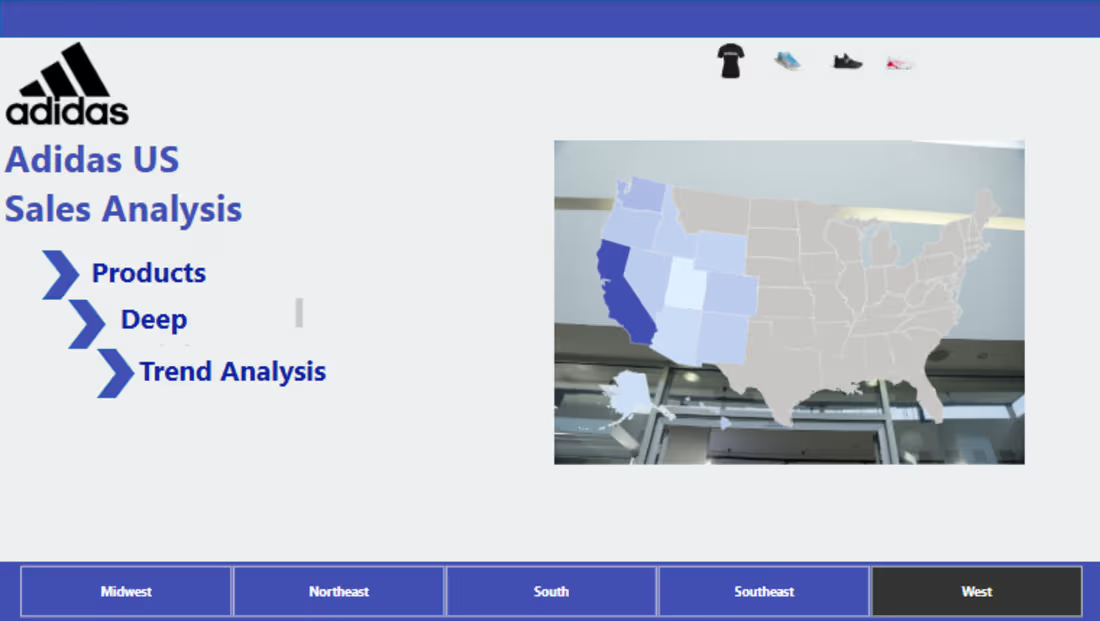
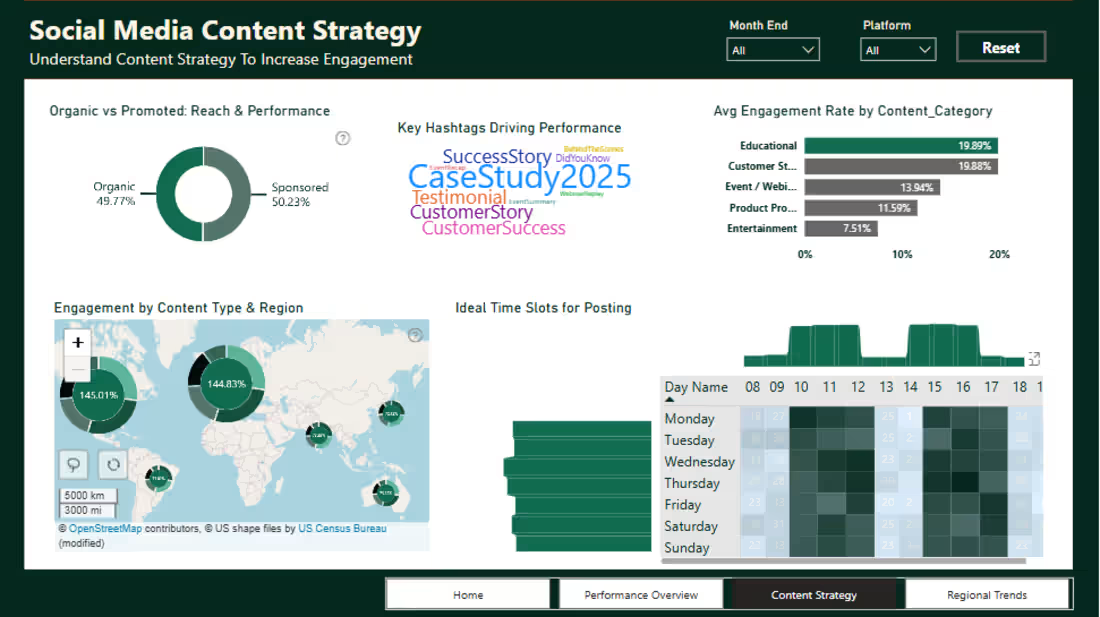
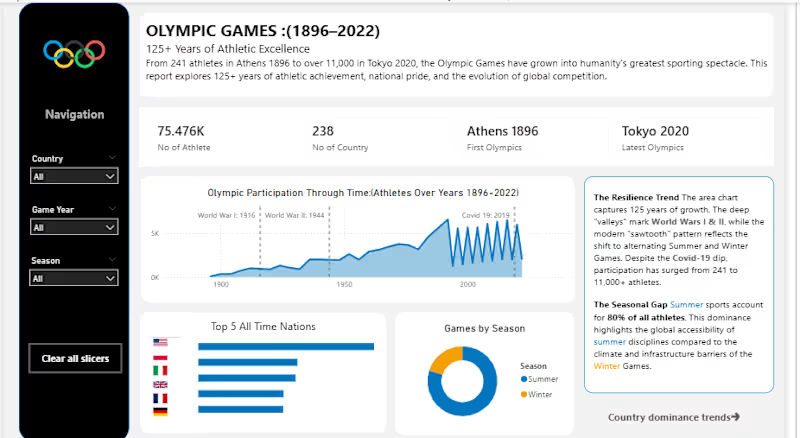
If a dashboard needs a manual, it’s broken. 📉
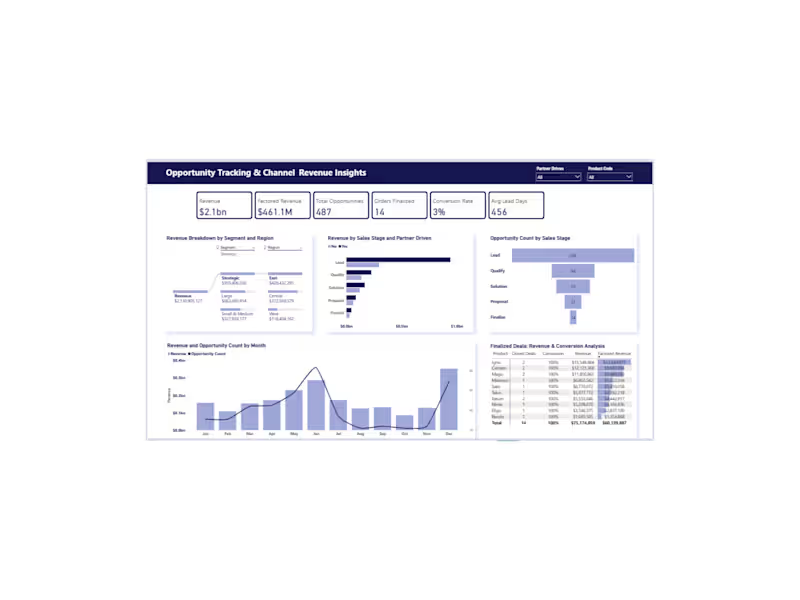
My submission for the #PowerBIWorldChampionship is live. My contrarian take? The most powerful data stories are the simplest ones.
I don't build "busy" reports. I build clarity. I help clients see through the noise to make 10x faster decisions.
Check out my entry below. Let's talk about simplifying your data. 🚀
Check out the interactive report here: https://lnkd.in/eC6cgFDs
#PBIC2026 #DataViz #Analytics #PowerBI #DataStrategy
1
3
115
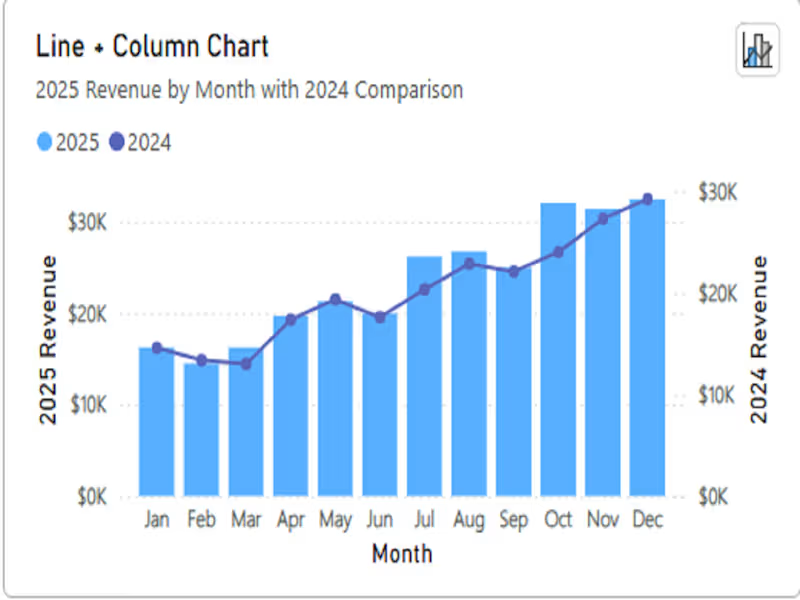
Intentional Chart Design 📊
This chart compares 2025 monthly revenue with 2024 performance to answer one question:
👉 Are we growing year over year?
• Bars = current year clarity
• Line = quick YoY context
• Clean layout = faster decisions
I design Power BI visuals to be simple, intentional, and business-focused.
Open to Power BI contract work.
1
136
📊 A reminder while building visuals in Power Bl
A good visual isn’t about adding more charts — it’s about making the insight obvious.
hashtag#PowerBI (https://www.linkedin.com/search/results/all/?keywords=%23powerbi&origin=HASH_TAG_FROM_FEED) hashtag#DataVisualization (https://www.linkedin.com/search/results/all/?keywords=%23datavisualization&origin=HASH_TAG_FROM_FEED) hashtag#VisualDesign (https://www.linkedin.com/search/results/all/?keywords=%23visualdesign&origin=HASH_TAG_FROM_FEED) hashtag#LearningInPublic (https://www.linkedin.com/search/results/all/?keywords=%23learninginpublic&origin=HASH_TAG_FROM_FEED) hashtag#AnalyticsJourneyy (https://www.linkedin.com/search/results/all/?keywords=%23analyticsjourney&origin=HASH_TAG_FROM_FEED)
23
224
