Projects using Microsoft Excel in Greater Accra RegionProjects using Microsoft Excel in Greater Accra Region Excel Data Analytics Project | Revenue Performance Dashboard
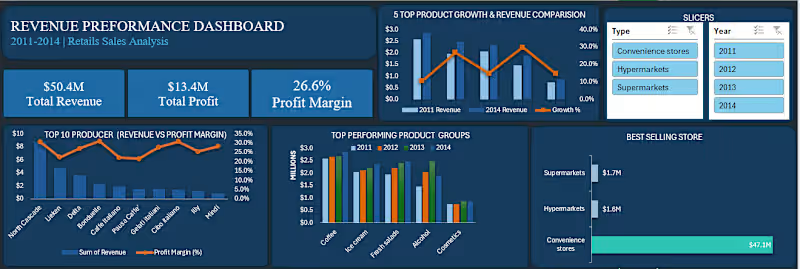
I built an interactive Revenue Performance Dashboard in Excel to analyze revenue, profit, and product performance across multiple years (2011–2014).
🔍 Key Insights from the Analysis:
1.North Cascade consistently led revenue generation, making it the primary growth driver across all years.
2.Coffee (http://2.Coffee) and Fresh Salads emerged as the top performing product groups, contributing the highest share of total revenue.
3. Convenience Stores generated the highest total revenue , indicating strong market reach.
4.Supermarkets recorded the strongest profit margins ,reflecting higher efficiency in cost and pricing structures.
5.Despite revenue growth over time, profit margins remained relatively stable (~26–28%), suggesting controlled cost structures rather than aggressive price increases.
6.A small number of products recorded negative margins, signaling pricing or cost inefficiencies that require attention.
📌 Strategic Recommendations
1.Increase investment in high-performing categories (e.g., Coffee).
2.Strengthen distribution through Convenience Stores to maximize revenue reach.
3.Reassess low-margin product pricing strategies.
4.Implement customer feedback systems to improve product positioning.
🛠 Tools & Skills Demonstrated:
Microsoft Excel (Pivot Tables, Pivot Charts, Slicers)
Data cleaning and transformation
KPI design and dashboard storytelling
Business performance and trend analysis
This project reflects my approach to analytics:
turning raw data into clear, actionable insights for decision-making.