
Data Analyst | Power BI Dashboards | Excel SQL | KPI Report
Data Analyst | Power BI Dashboards | Excel SQL | KPI Report
Excel Data Analytics Project | Revenue Performance Dashboard
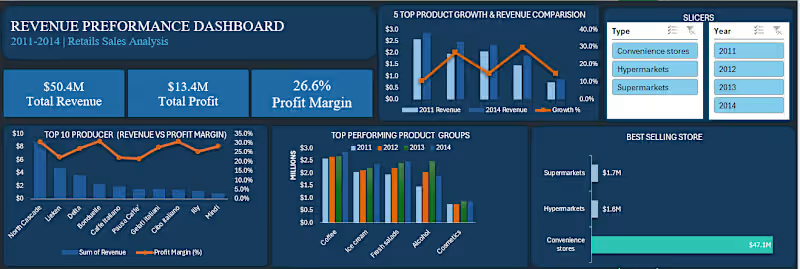
I built an interactive Revenue Performance Dashboard in Excel to analyze revenue, profit, and product performance across multiple years (2011–2014).
🔍 Key Insights from the Analysis:
1.North Cascade consistently led revenue generation, making it the primary growth driver across all years.
2.Coffee (http://2.Coffee) and Fresh Salads emerged as the top performing product groups, contributing the highest share of total revenue.
3. Convenience Stores generated the highest total revenue , indicating strong market reach.
4.Supermarkets recorded the strongest profit margins ,reflecting higher efficiency in cost and pricing structures.
5.Despite revenue growth over time, profit margins remained relatively stable (~26–28%), suggesting controlled cost structures rather than aggressive price increases.
6.A small number of products recorded negative margins, signaling pricing or cost inefficiencies that require attention.
📌 Strategic Recommendations
1.Increase investment in high-performing categories (e.g., Coffee).
2.Strengthen distribution through Convenience Stores to maximize revenue reach.
3.Reassess low-margin product pricing strategies.
4.Implement customer feedback systems to improve product positioning.
🛠 Tools & Skills Demonstrated:
Microsoft Excel (Pivot Tables, Pivot Charts, Slicers)
Data cleaning and transformation
KPI design and dashboard storytelling
Business performance and trend analysis
This project reflects my approach to analytics:
turning raw data into clear, actionable insights for decision-making.
0
48


Digital Branding & IT Lead | Advanced Data Analyst & AI Tool
Digital Branding & IT Lead | Advanced Data Analyst & AI Tool


☕ Brew & Bloom — Premium Corporate Brand Identity System
This design system is anchored by three core visual assets, sequenced to provide a full understanding of the brand's aesthetics and real-world application:
1. The Identity System Overview: This image serves as the primary technical overview, displaying the full front design and the detailed back layout. It is the best resource for viewing the typography grid and the asymmetrical information hierarchy.
2. Contextual Lifestyle Mockup (Primary): A top-down presentation showing the main brand card angled next to a fresh, amber-glass tray of frothed espresso. This merges digital vector art with the tactile product.
3. Contextual Lifestyle Mockup (Detail View): A similar top-down presentation, but focusing on the reverse contact side of the card. This validates the hierarchy of information (phone, email, global address) in a real-world setting.
0
44

Smart Business Intelligence & Analytics Platform
This project is a full-stack digital transformation solution designed to help small and medium-sized businesses track, analyze, and optimize their operations using real-time data insights.
It was built as a business-focused dashboard system that centralizes key operations such as sales tracking, performance monitoring, and decision-making into one clean and intuitive interface.
The goal of this project was to solve a common problem faced by small businesses:
Lack of clear visibility into sales performance, customer behavior, and business growth due to manual tracking systems.
This platform replaces traditional manual processes with a smart, data-driven dashboard system.
The system provides business owners with:
📊 Real-time sales analytics and performance tracking
💰 Revenue monitoring and financial insights
🧾 Transaction and sales overview
👥 Customer insights and activity tracking
📦 Product and inventory visibility
📈 Business performance reports for decision-making
0
39

I help small businesses stay on top of their books.

Captured bills, invoices, and expense transactions into QuickBooks for an SME client, ensuring all records were accurately categorized and saved with zero errors.
0
81
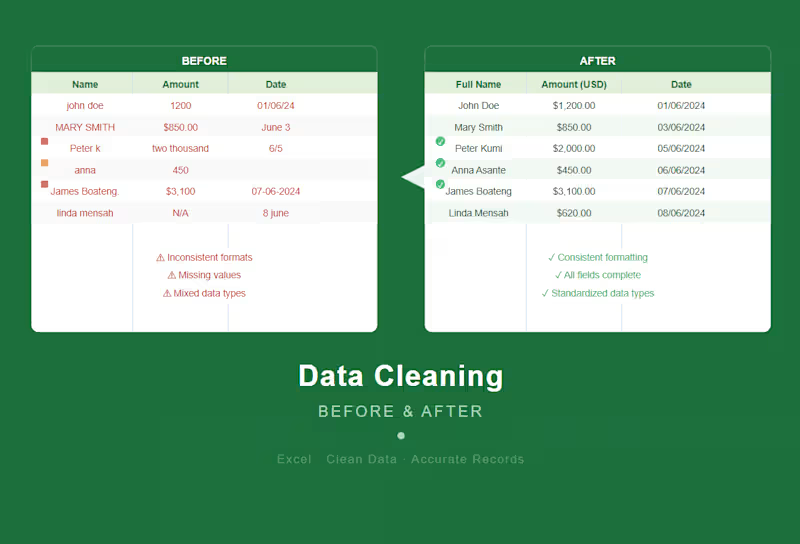
Took a messy, inconsistent dataset with missing values, mixed formats, and duplicate entries and cleaned it into a structured, analysis-ready Excel spreadsheet.
0
70

Tailored website, data analysis, and UI/UX design solutions.
Tailored website, data analysis, and UI/UX design solutions.


View more →

Data Analyst | Data Science | Econometrics | Business
Data Analyst | Data Science | Econometrics | Business


View more →