MongoDB Atlas Data Management & Interactive Dashboard
Project Overview😍
- The project focuses on leveraging MongoDB Atlas for efficient data storage, management, processing, and visualization through interactive dashboards. The solution enables organizations to manage structured and unstructured data, monitor business operations, and transform raw information into meaningful insights through real-time data access and analytics.
Project Requirements:
1. Configure and manage cloud-based databases using MongoDB Atlas.
2. Design efficient database schemas and collections for business data.
3. Implement CRUD operations for seamless data management.
4. Develop secure database connectivity using APIs and backend applications.
5. Perform data aggregation, filtering, querying, and transformation.
6. Build interactive dashboards to visualize business metrics and KPIs.
7. Enable real-time or near-real-time data monitoring and reporting where supported.
8. Implement database indexing and query optimization for better performance.
9. Integrate MongoDB Atlas with analytics tools and application workflows.
10. Ensure data security, access control, backup, and scalability.
Overall Business Impact:
- The combination of MongoDB Atlas, data analytics, and interactive dashboards creates a scalable data management ecosystem that improves data accessibility, operational visibility, reporting efficiency, and strategic decision-making.
#Blackcoffer #MongoDB #MongoDBAtlas #DatabaseManagement #DataAnalytics #DataVisualization #InteractiveDashboard #BusinessIntelligence #DashboardDevelopment #CloudDatabase #NoSQL #BigData #DataEngineering #DataManagement #RealTimeAnalytics #DataDriven #CloudComputing #DigitalTransformation #DataInsights #TechnologyInnovation
0
25
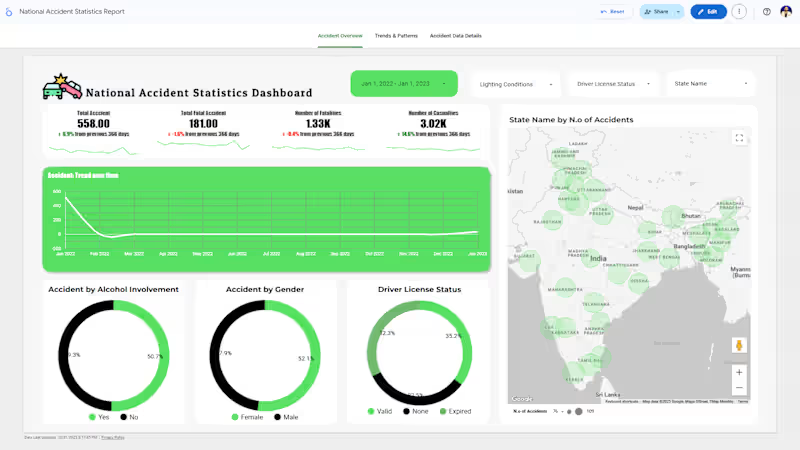
National Accident Statistics Dashboard in Google Looker Studio:
I built an interactive Looker Studio dashboard using Google Sheets as the data source to visualize national accident statistics. The report analyzes accidents by region, time, severity, and demographics. A scheduled data re:fresh every 15 minutes keeps the dashboard updated in real time. As a Data Visualization Expert, I combined automation and design to deliver a clean, insightful, and dynamic Looker Studio dashboard for data-driven decision-making.
🎉 💯 🎉
2
198

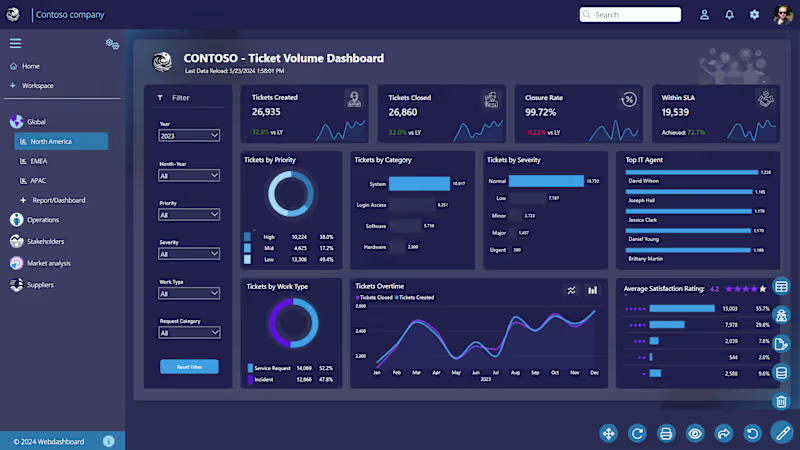
IT Service Management Dashboard Project
Developed an interactive IT Service Management dashboard to monitor ticket volume, incident trends, SLA performance, and support team efficiency. Analyzed operational support data to identify service bottlenecks, improve response times, and support data-driven operational decisions.
Key Business Insights & Decisions:
Monitored ticket creation and closure trends to improve operational efficiency
Identified high-priority and high-severity incidents requiring immediate attention
Tracked SLA compliance rates to reduce delayed ticket resolutions
Analyzed support categories and work types to optimize resource allocation
Evaluated top-performing IT agents based on ticket resolution performance
Improved service quality monitoring through customer satisfaction analysis
Dashboard Highlights:
Ticket Volume & Closure Tracking
SLA Performance Monitoring
Ticket Priority & Severity Analysis
Support Category Breakdown
IT Agent Performance Analysis
Customer Satisfaction Metrics
Interactive Filters for Dynamic Reporting
Skills Used:
Data Cleaning & Transformation
Exploratory Data Analysis (EDA)
KPI Monitoring & Reporting
Operational Data Analysis
Data Visualization
Dashboard Development
Business Intelligence Reporting
Insight-Driven Decision Making
Tools & Technologies:
Power BI • Excel • SQL • Python • DAX • Data Visualization
0
35


5 signs your business needs automation:
1️⃣ You copy-paste data between files daily
2️⃣ Your reports take more than 30 minutes to prepare
3️⃣ You've found errors in your spreadsheets more than once
4️⃣ You don't know your real-time sales or inventory right now
5️⃣ Your team does the same task more than 3 times a week
If you said yes to even 2 of these —
you're losing money to manual work.
I fix this using:
→ SQL (connects and cleans your data)
→ Advanced Excel (automates your reports)
→ Power BI (shows everything in real time)
→ AppSheet (gives your team a mobile app)
→ Google Sheets (collaborates automatically)
Starting from $69. No long contracts.
Check my profile 👇
#businessautomation #dataanalyst #powerbi
#excel #sql #freelancer #nocode #contra
1
117