

Sales Analytics Dashboard Design |
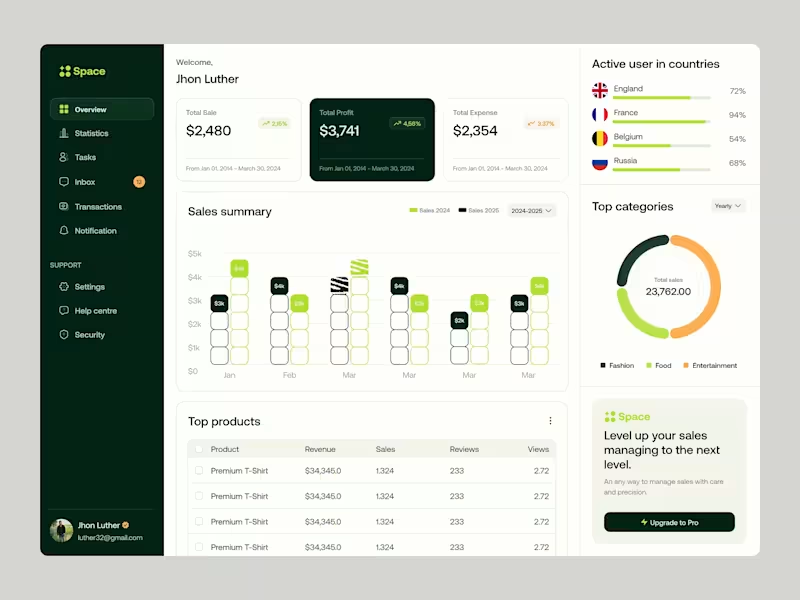
The Space Dashboard is a sophisticated, data-centric SaaS platform designed for e-commerce managers and business owners. It focuses on high-level financial tracking, Sales, Profits, and Expenses. through a dark-themed sidebar and a light, breathable content area. The interface balances high-density data visualization with an approachable, clean aesthetic to ensure users can monitor global performance metrics without cognitive overload.
Key Design Features:
Unified Global Tracking: Real-time user distribution maps and country-specific engagement bars.
Category Breakdown: An intuitive donut chart for "Top Categories" (Fashion, Food, Entertainment) to identify revenue drivers quickly.
Product Performance Table: A clean, actionable list view for "Top Products" featuring revenue, sales volume, and user sentiment (reviews).
Modular "Upgrade to Pro" Widget: A non-intrusive, conversion-focused call-to-action designed to drive SaaS revenue.
2
4
288






Most small businesses are making decisions off numbers they don't fully trust.
Mismatched reports. Spreadsheets that take hours to update. Metrics that mean different things to different people.
I spent 4 years fixing exactly this at HCA Healthcare across 186 facilities and at Dell across 100+ enterprise accounts. Reduced manual reporting by 60%. Standardized 30+ KPIs so every team was finally working from the same numbers.
Now I bring that same rigor to smaller teams that need real analytics without hiring a full-time analyst.
If your data is a mess or your reporting takes longer than it should, that's exactly what I do.
Open to dashboard builds, SQL audits, and monthly reporting setups. DMs open. https://public.tableau.com/app/profile/jovanne.saldierna/viz/ShippingCostIntelligenceSystem/ShippingCostIntelligence
1
110