Power BI Data Analyst + ML AI Automation Expert
- 5.0
- Rating
- 114
- Followers
Power BI Data Analyst + ML AI Automation Expert
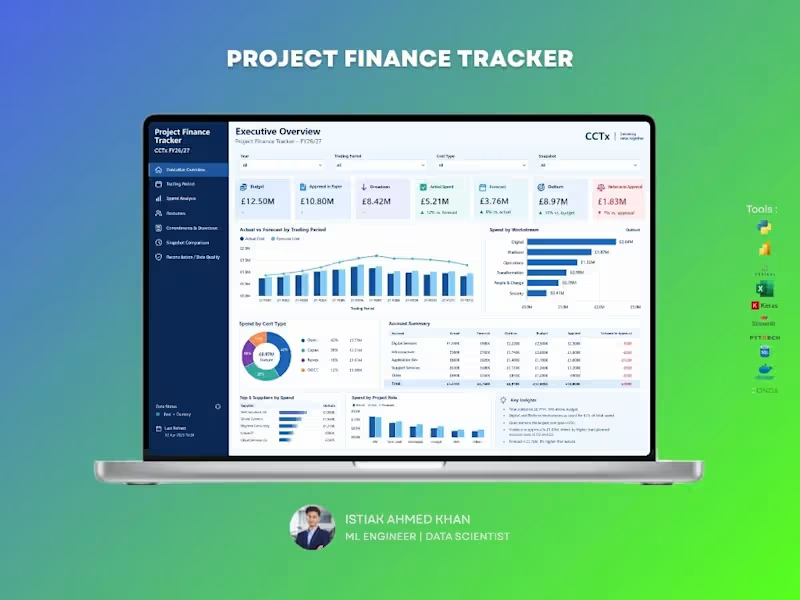
Project Finance Tracker Dashboard
A comprehensive dashboard designed to help project teams monitor budgets, actual spending, forecasts, commitments, and financial variances in one place. Track performance by trading period, cost type, workstream, supplier, and project role. Identify overspending, forecast gaps, and approval requirements early to improve financial control, reporting accuracy, and project decision-making.
1
83
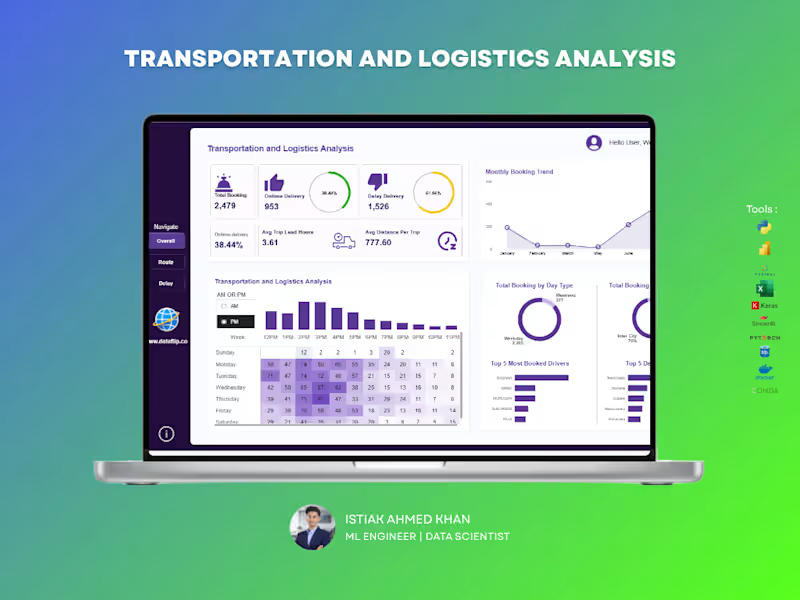
Managing logistics operations without clear insights can lead to delays, inefficiencies, and lost revenue. This dashboard is built to give you complete visibility into your transportation performance — all in one place.
A powerful analytics solution that helps you track bookings, delivery performance, delays, and operational efficiency in real time. Designed for clarity and speed, so you can make decisions without digging through raw data.
🔹Monitor on-time vs delayed deliveries instantly
🔹Track booking trends and operational workload over time
🔹Analyze trip efficiency with lead time and distance metrics
🔹Identify peak hours and demand patterns
🔹Evaluate top drivers and most frequent routes/destinations
🔹Compare weekday vs weekend performance
If you want a clean, professional dashboard that turns your logistics data into real operational insights, I can build a custom solution tailored to your business needs.
2
7
344
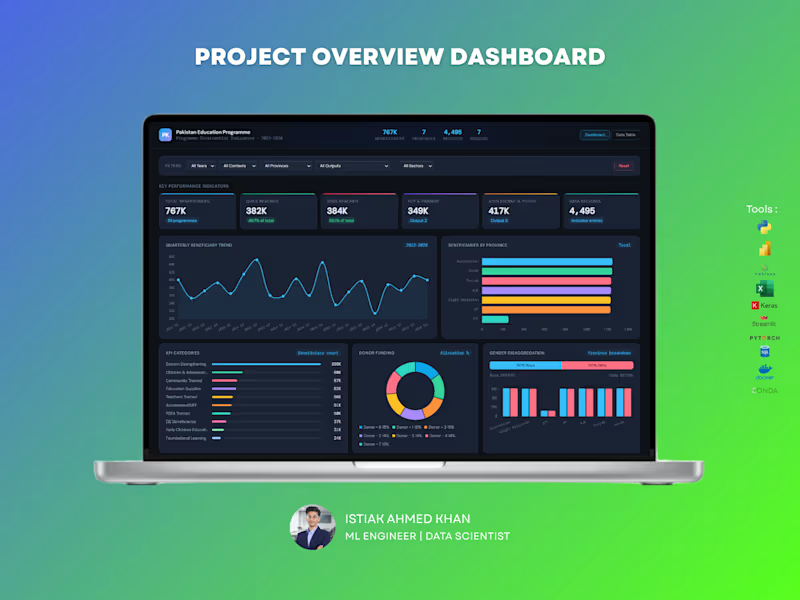
Education Program Analytics Dashboard – Data Analytics Solution
Handling large-scale program data without clear visibility can make impact measurement difficult. This dashboard is designed to give organizations a complete, real-time view of program performance, reach, and funding — all in one place.
What You Get :
A powerful, interactive dashboard that helps track beneficiaries, program outputs, regional performance, and donor contributions with clarity and precision.
Key Capabilities:
Monitor total beneficiaries and gender distribution
Track program reach across provinces and sectors
Analyze quarterly trends and growth patterns
Evaluate donor funding allocation and impact
Identify top-performing program categories and outputs
Explore education level distribution and engagement
For NGOs and large programs, data is critical for decision-making and reporting. This dashboard helps you measure impact, improve transparency, and optimize resource allocation — making your data meaningful and actionable.
Perfect For :
NGOs and non-profit organizations
Government programs
International development agencies
Research and policy teams
If you want a professional, insight-driven dashboard that clearly communicates impact and performance, I can create a customized solution tailored to your organization.
1
429
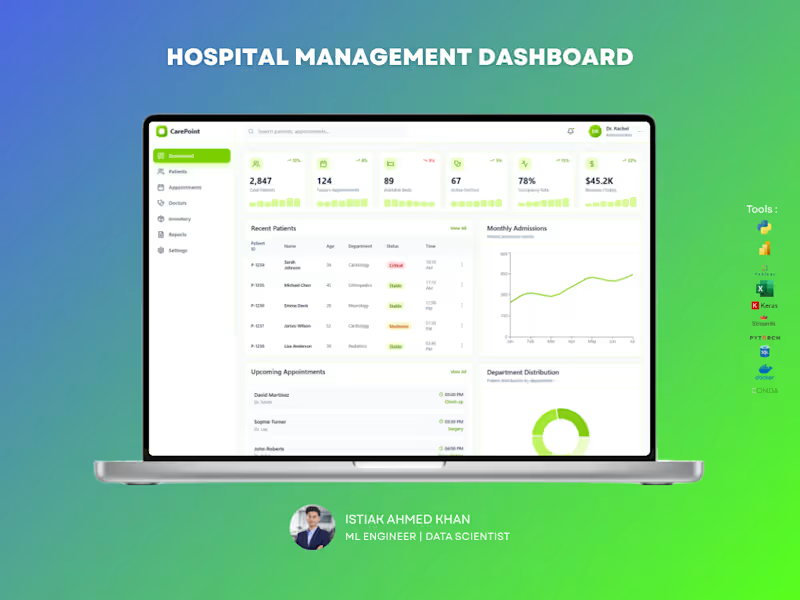
Email Marketing Analytics Dashboard – UI/UX Design
Struggling to track campaign performance across multiple channels? This dashboard is designed to give you a complete, real-time view of your marketing efforts in one clean and intuitive interface.
A powerful, easy-to-use dashboard that helps you monitor email, SMS, social media, and push campaigns without the confusion of scattered data. Every key metric is presented clearly so you can make faster, smarter decisions.
Key Capabilities:
Track open rates, click rates, conversions, and revenue in real time,
Compare performance across multiple marketing channels,
Identify your top-performing campaigns instantly,
Understand audience engagement with clear visual breakdowns,
Spot trends and optimize campaigns quickly.
Most businesses run campaigns but struggle to understand what’s actually working. This dashboard eliminates guesswork by turning your data into clear, actionable insights — helping you improve ROI and scale winning strategies.
Perfect For:
Digital marketers,
E-commerce brands,
Agencies managing multiple campaigns,
Startups looking to optimize growth.
If you want a high-converting, professional dashboard that not only looks great but drives real business decisions — I can help you build it.
8
18
1.1K


Data Analyst, Open to Junior & Freelance Roles


20+ Founders trust me for AI Product, AI UX & Agentic UX. ⚡
- 10
- Followers
20+ Founders trust me for AI Product, AI UX & Agentic UX. ⚡


Global Product Sourcing, Conversion Optimization, BI Report



Data Entry, Lead Gen & VA Specialist | Accurate & Reliable
Data Entry, Lead Gen & VA Specialist | Accurate & Reliable
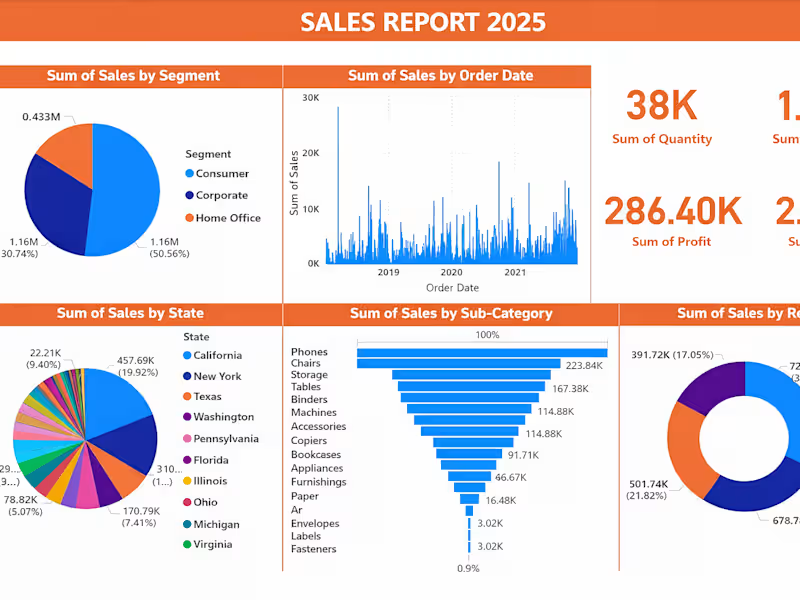
📊 AI-Powered Sales Dashboard | Project Completed
I’ve successfully completed this AI-assisted Sales Data Visualization project, transforming raw sales data into a clear, decision-ready dashboard.
✅ What this dashboard delivers:
Business-focused KPIs (Sales, Profit, Quantity, Discount)
Segment, Region, State & Category-wise performance analysis
Clean, modern, client-friendly visual layout
Easy insights for fast business decisions
🧠 My Role & Skills:
Data cleaning & structuring
KPI identification & analysis
AI-assisted data visualization
Dashboard design & data storytelling
📌 This project is fully completed and ready for real-world business use.
I don’t just visualize data — I turn data into business decisions.
6
4
147

Reliable and detail-oriented Data Entry Specialist, skilled in Excel, Google Sheets, and accurate data management to deliver fast and error-free results.
0
58


Data Analyst

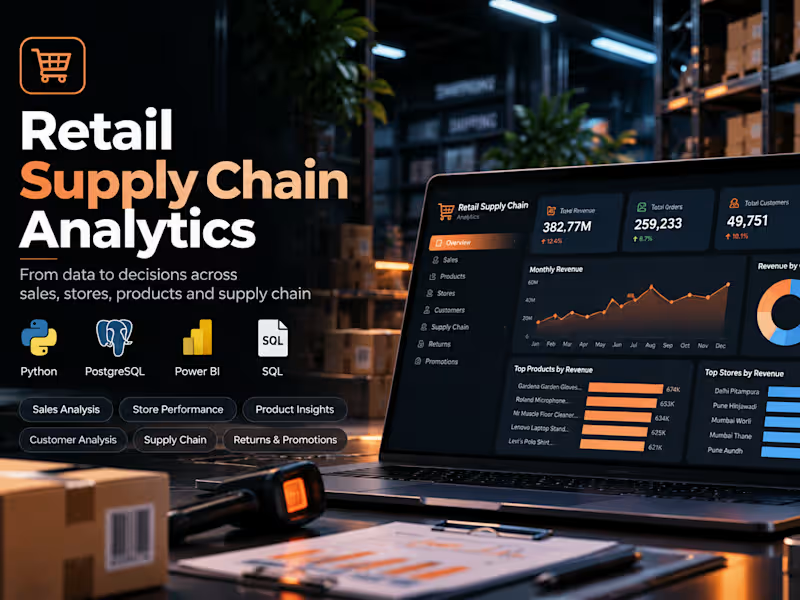

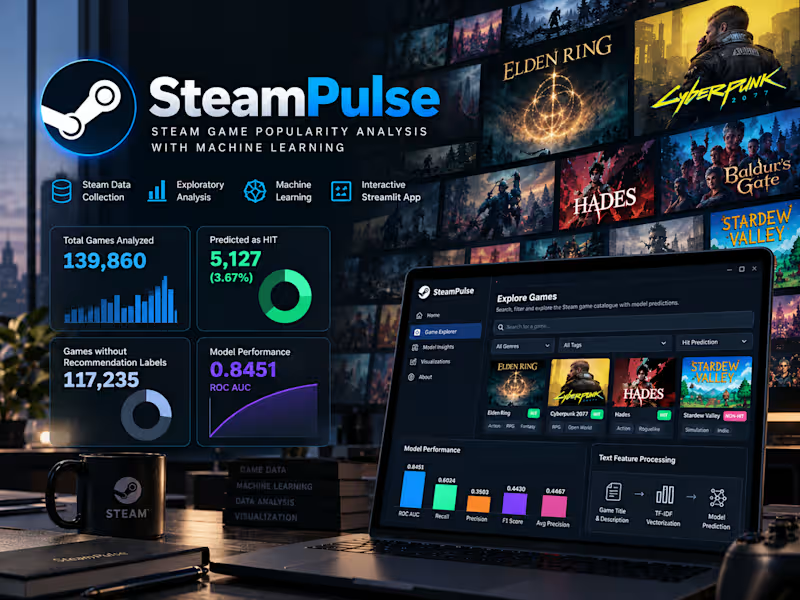

Data analyst | Python | SQL | Tableau | Excel | Power BI
Data analyst | Python | SQL | Tableau | Excel | Power BI
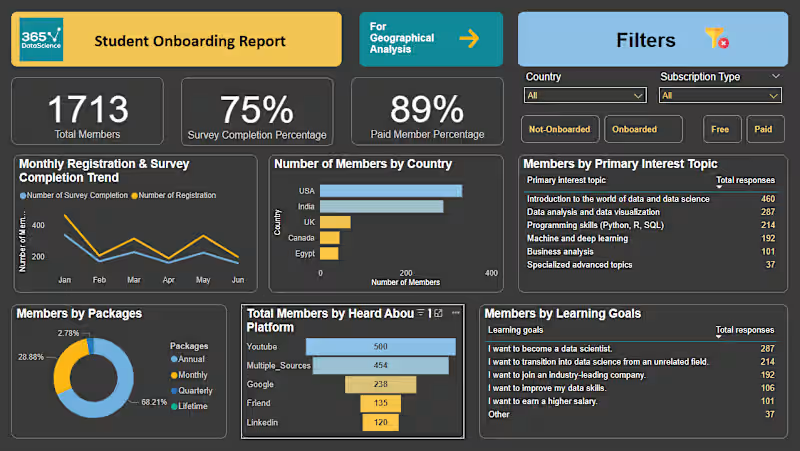


Product Designer For SaaS, Dashboards & Website