
Ahmed-Fardin/E-Commerce-Retail-Supply — End-to-end retail analytics using Python, PostgreSQL, SQL, and Power BI. · 1 stars · 0 forks · 0 watching
Retail Supply Chain
An end-to-end retail analytics project built with Python, PostgreSQL, SQL, and Power BI. It explores sales, products, stores, customers, suppliers, promotions, shipments, and returns through a relational data model and a seven page interactive dashboard.
The dataset has been obtained from kaggle datasets and is synthetic and intended for data analytics practice and demonstration.
The currency is unspecified.
KPI results depend on the DAX definitions, relationship configuration, and report filters.
Dashboard Preview
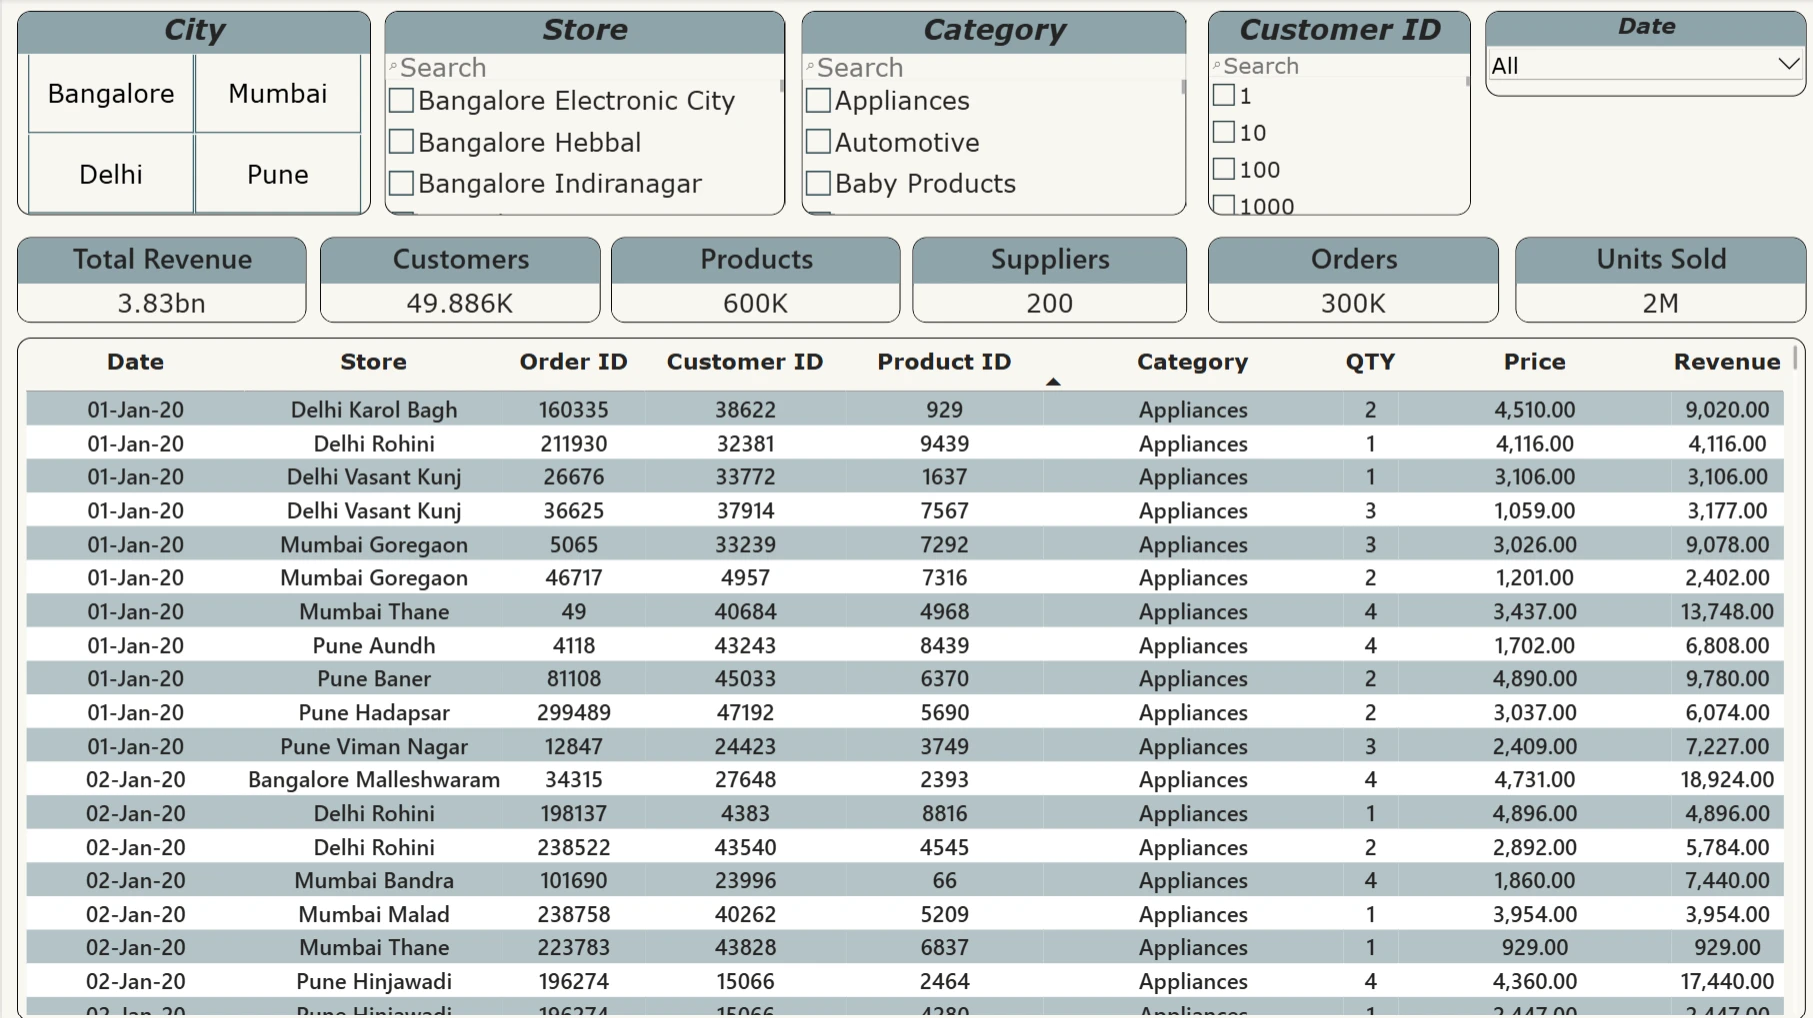
1. Executive Overview
KPIs and order details, with filters for city, category, store, customer, and date.
2. Sales & Revenue
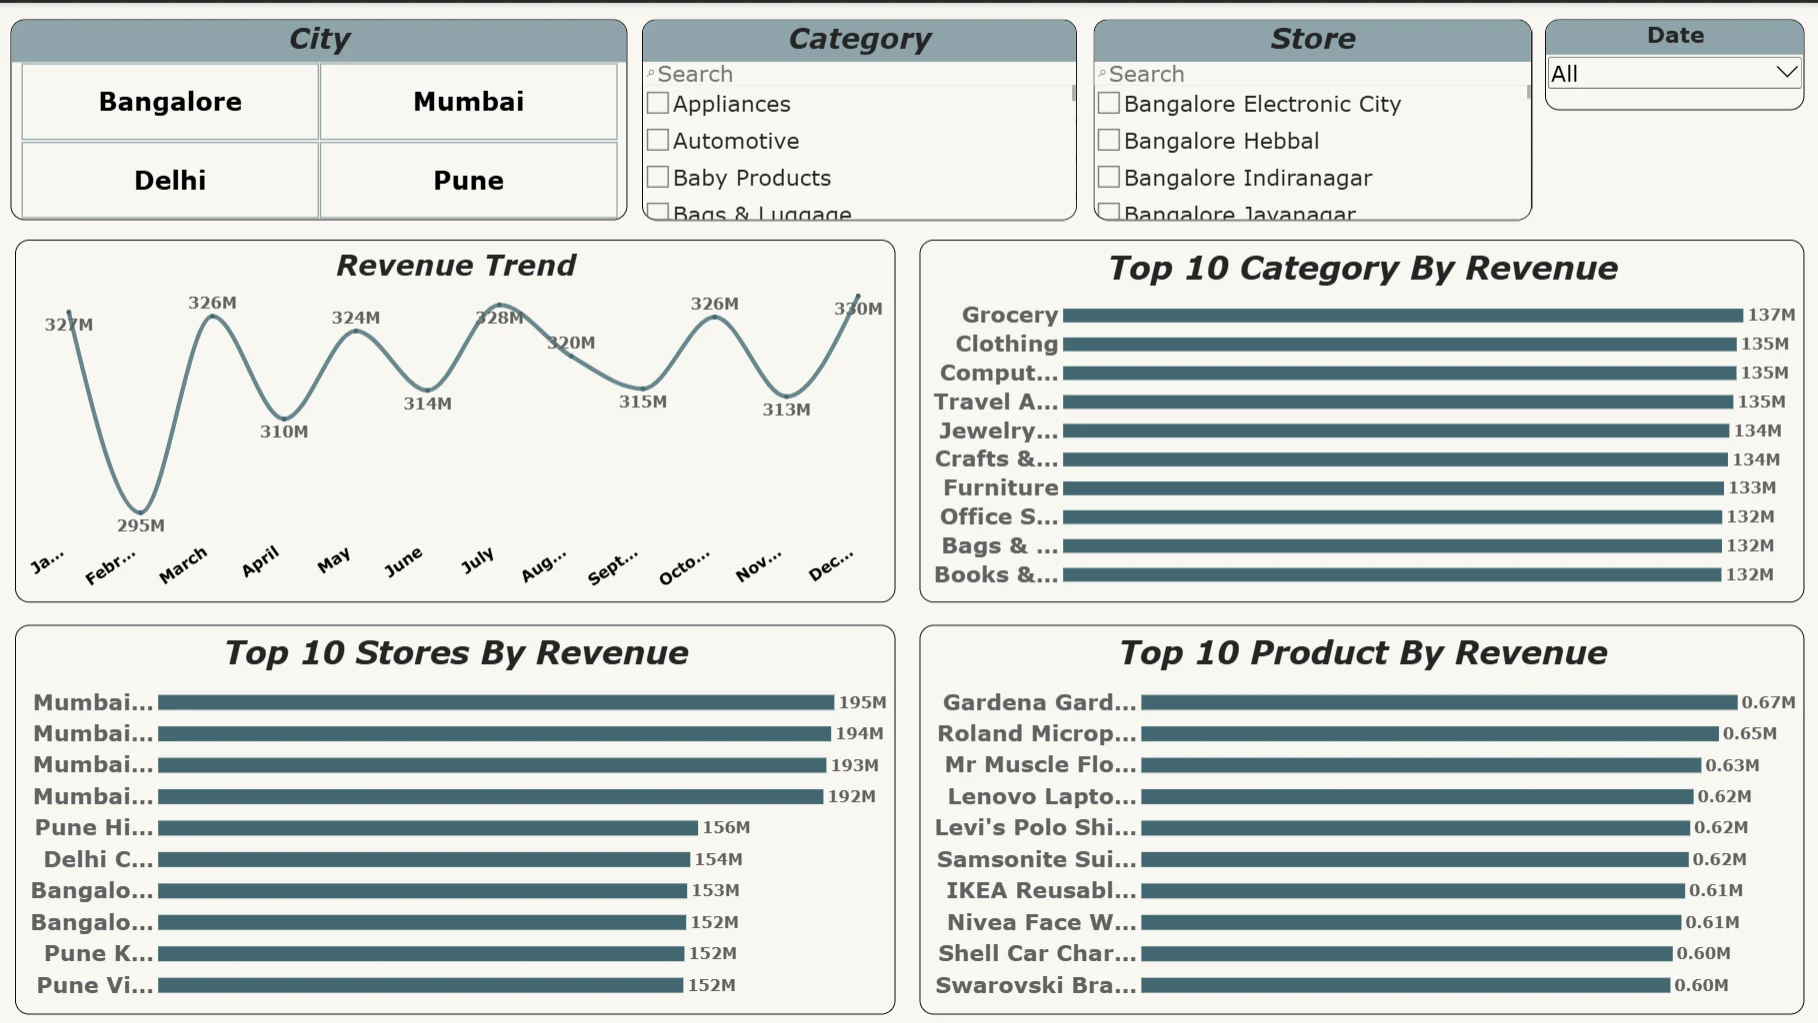
Revenue trends and comparisons across categories, stores, and products.
3. Product Analysis
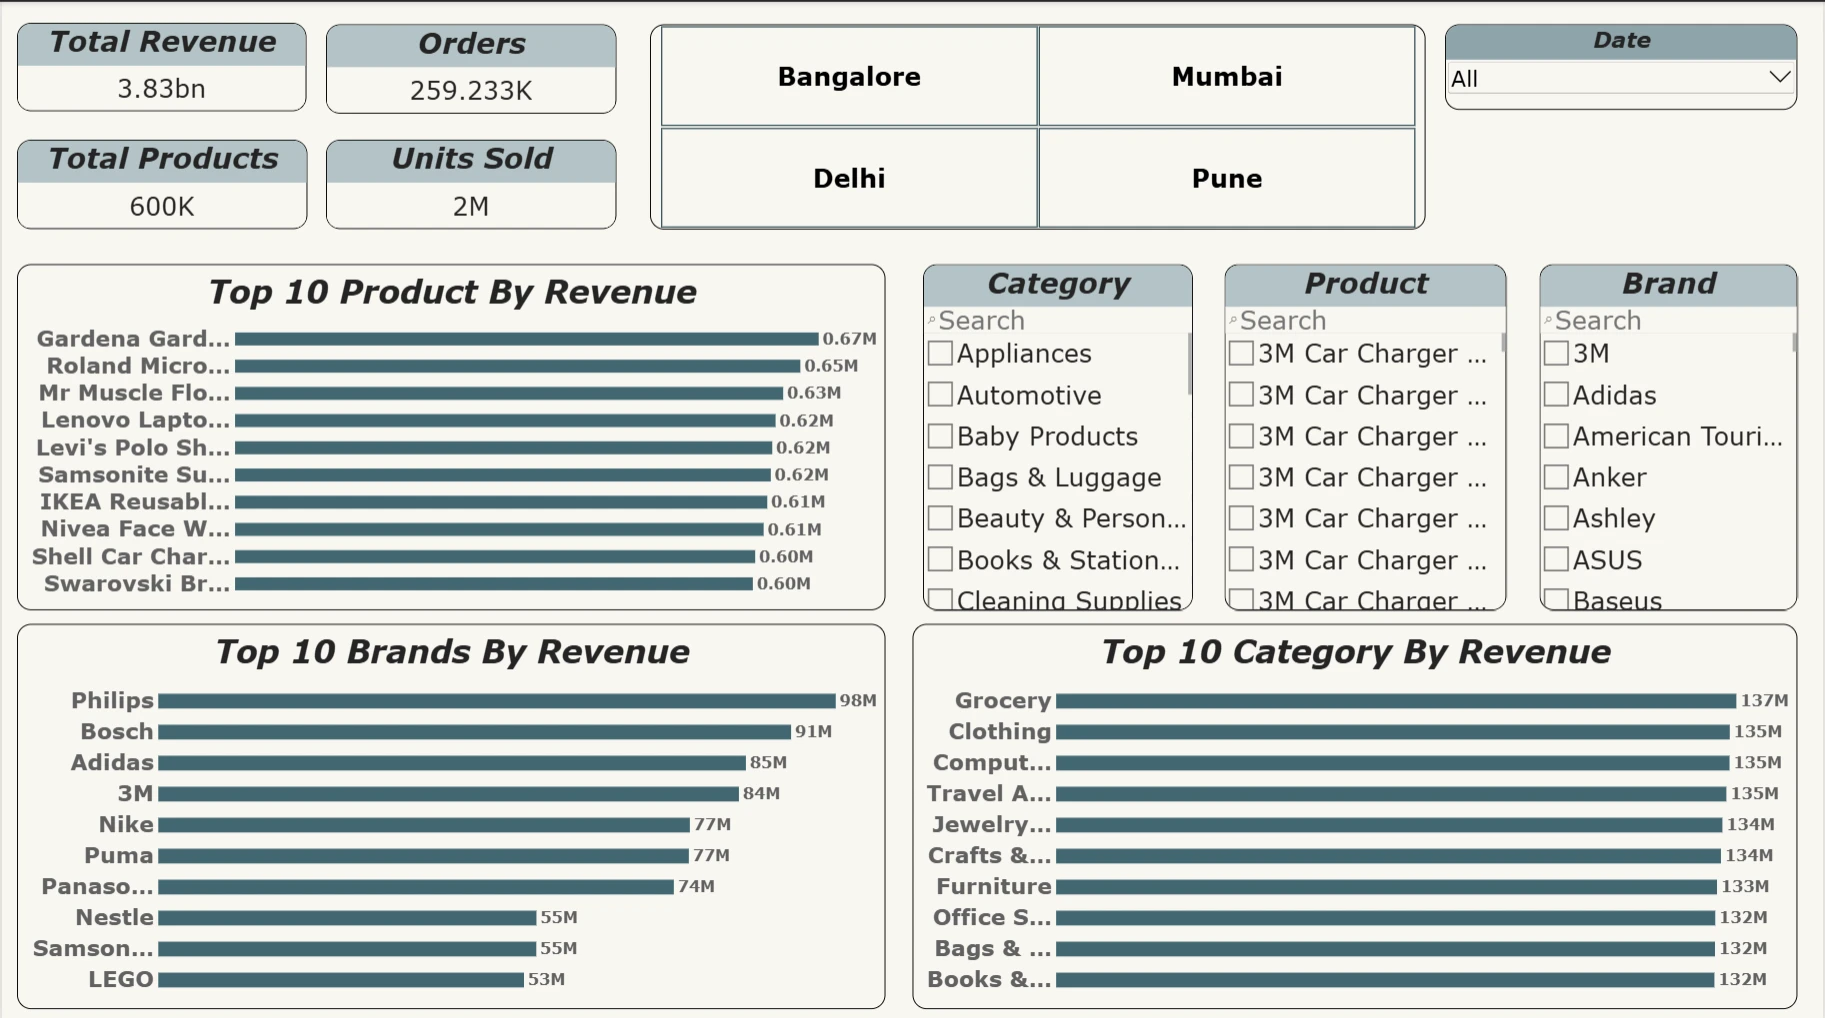
Product, brand, and category performance, including top performing items.
4. Store Performance
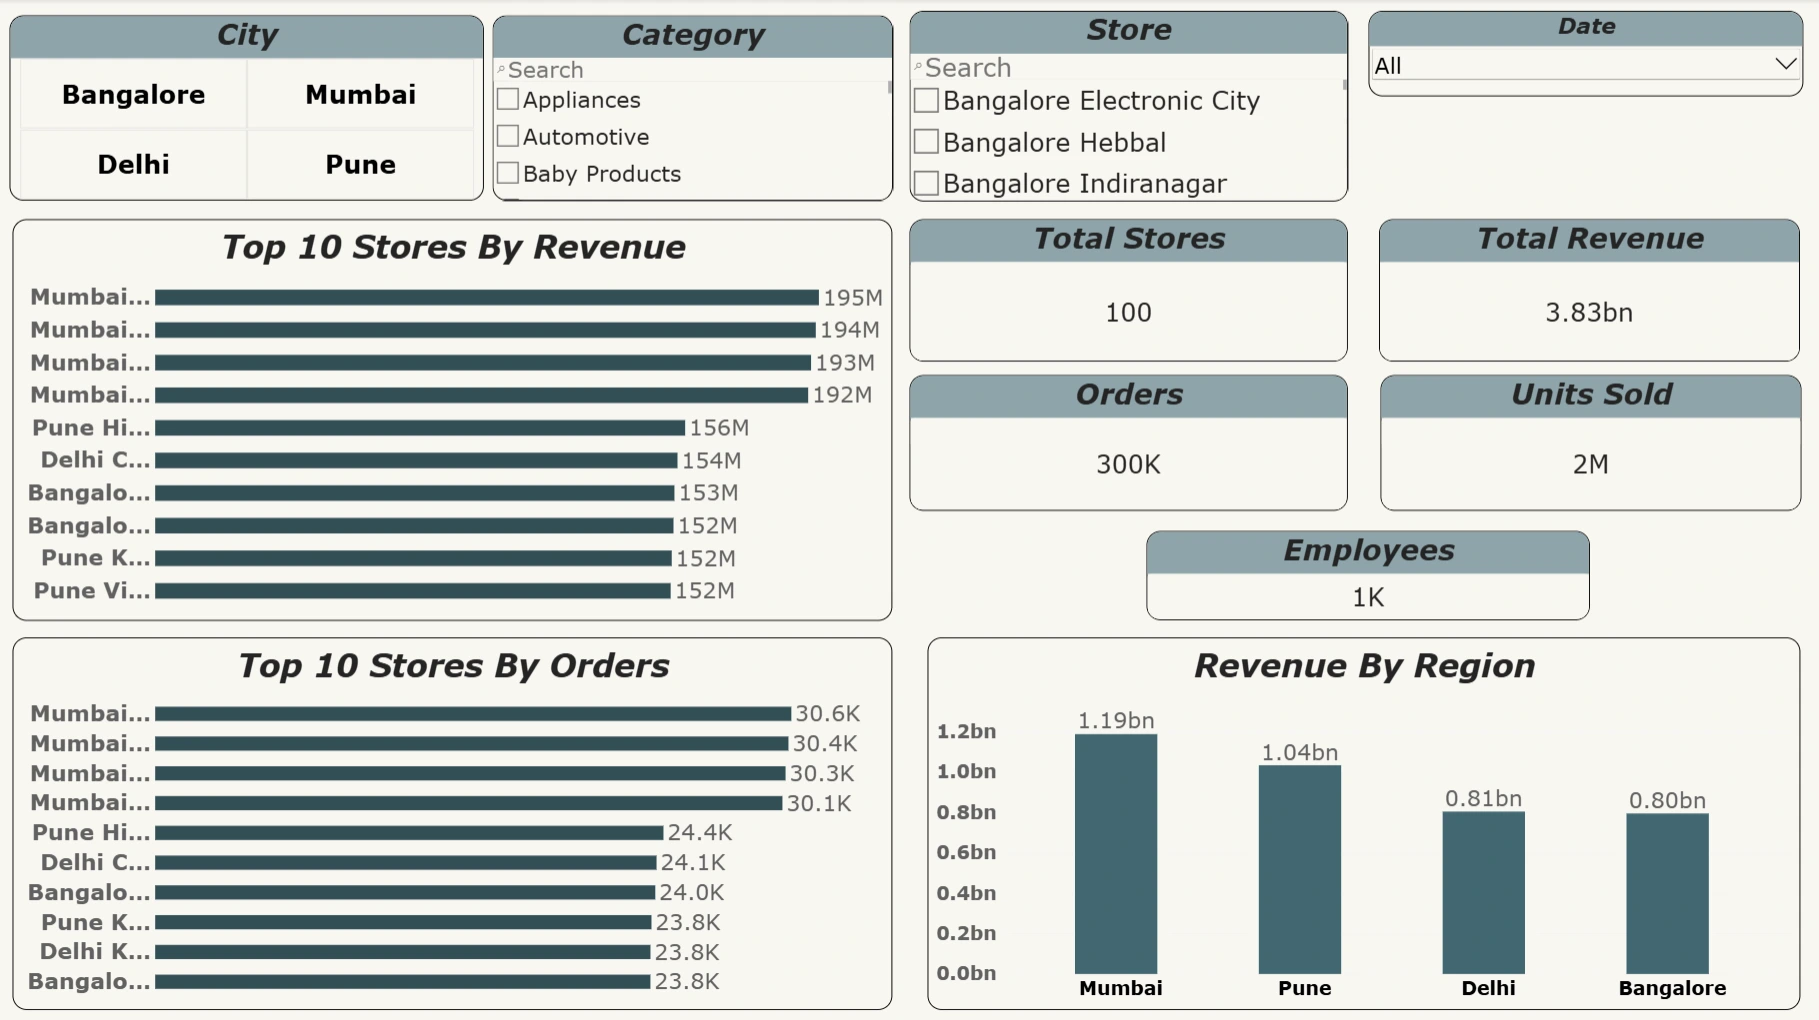
Store rankings by revenue and order volume, regional revenue, and store related KPIs.
5. Customer Analysis
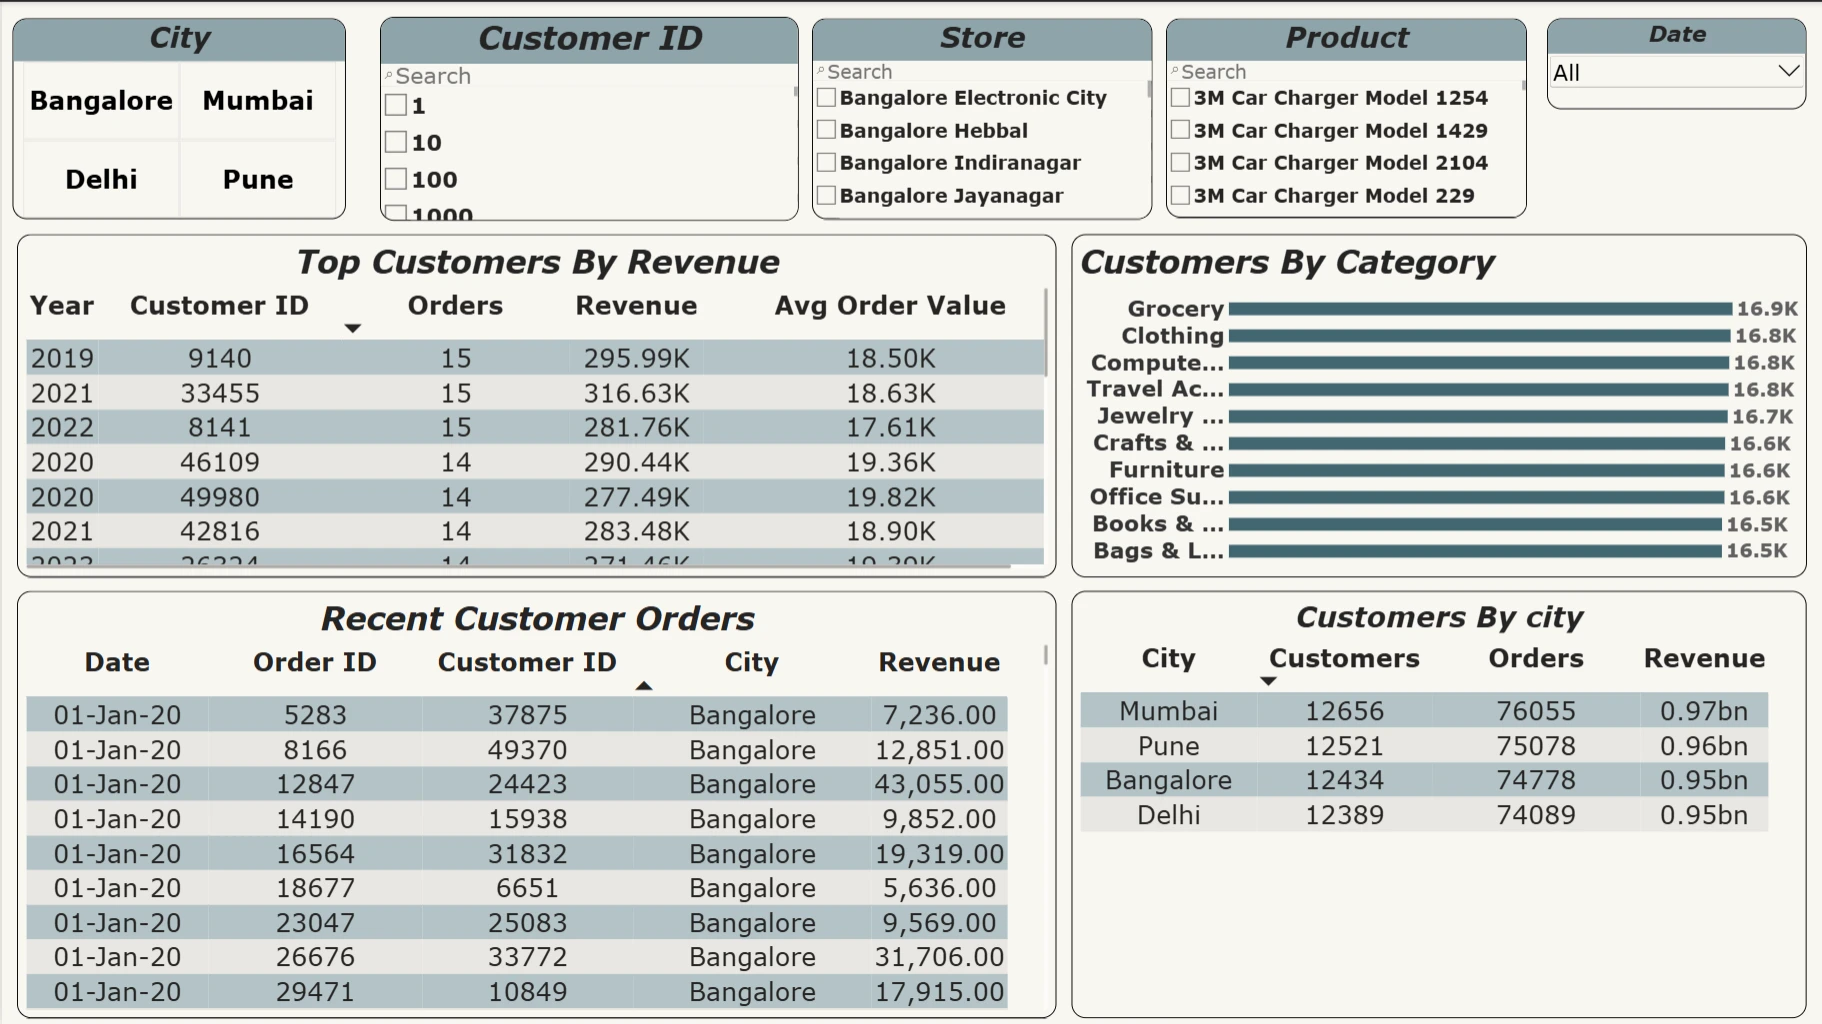
Customer revenue, order activity, city level customer summaries, and recent customer orders.
6. Supplier Analysis
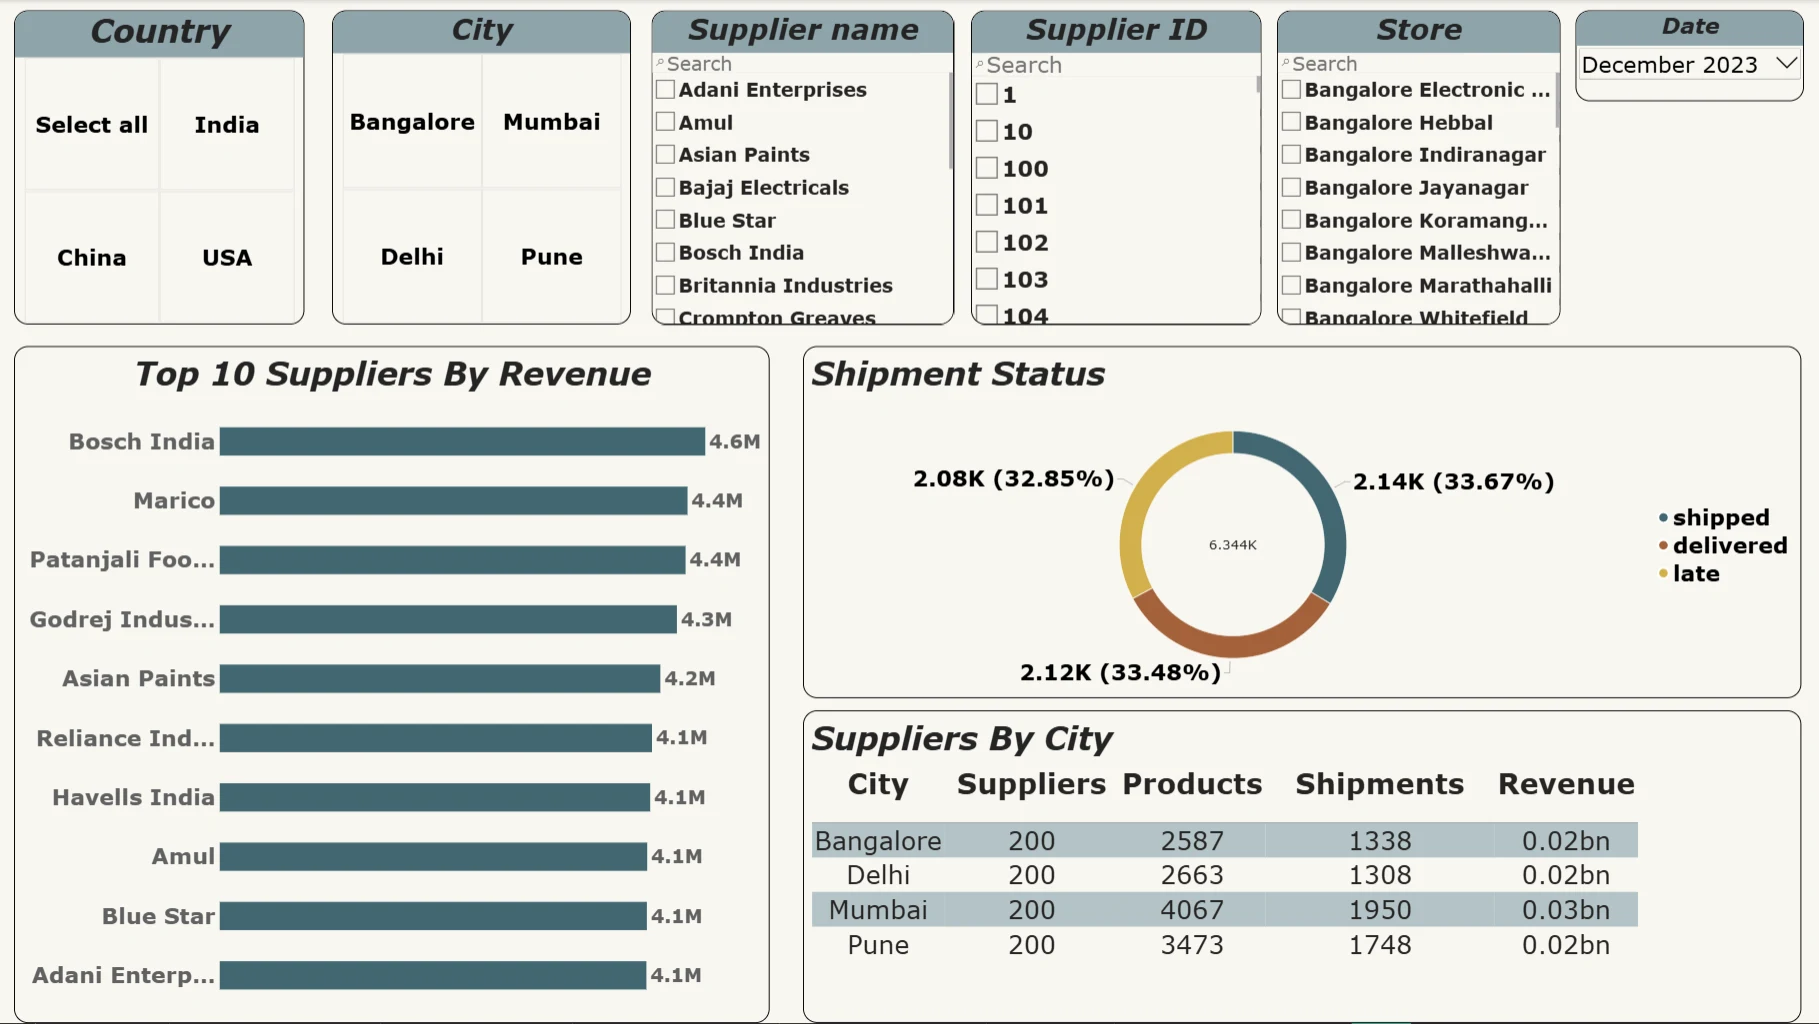
Supplier rankings, supplier related metrics, and shipment status distribution.
7. Returns & Promotions
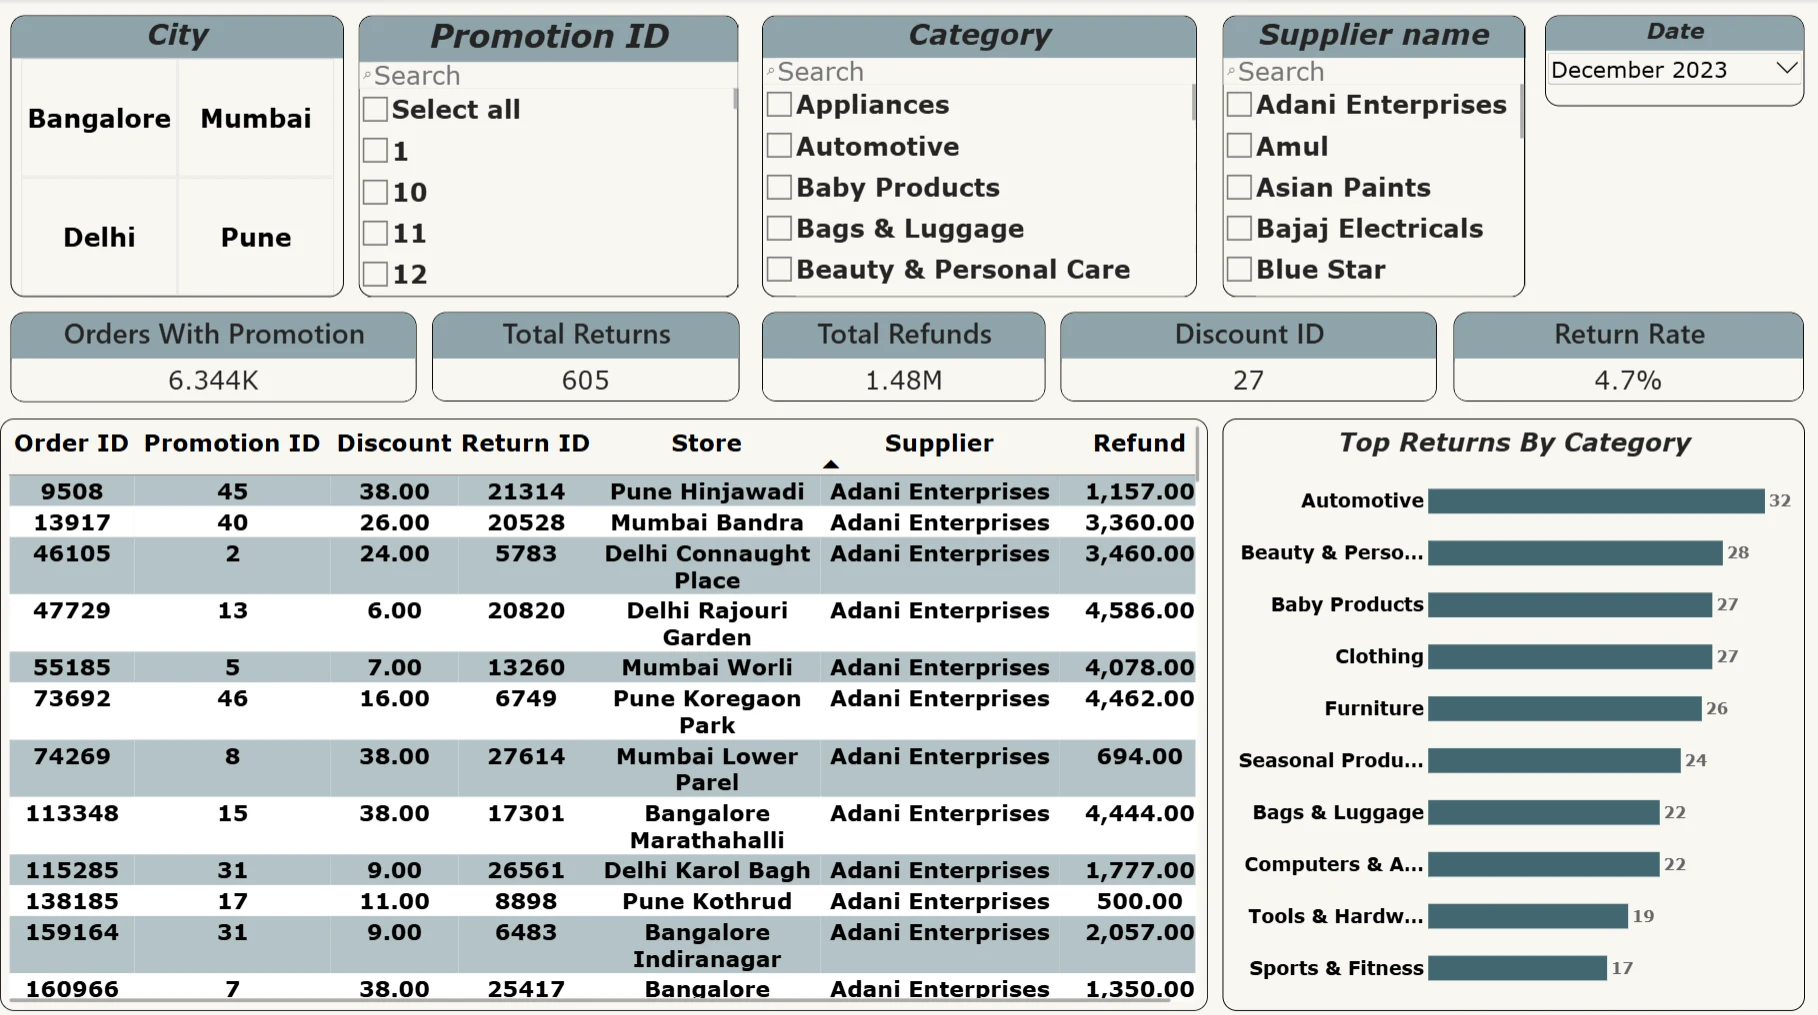
Returns, refunds, promotion information, return rate metrics, and category level return patterns.
Tools Used
Python Data generation and validation scripts
PostgreSQL Relational data storage and SQL querying
pgAdmin PostgreSQL database administration
Power BI Desktop Data modeling, DAX measures, and dashboard development
Visual Studio Code Python development and project organization
Data coverage
Order date range: 1 January 2020 -- 1 January 2024
Customer/store cities: Bangalore, Delhi, Mumbai, and Pune
Supplier countries represented: India, China, and USA
Database: PostgreSQL
Row counts are approximate and may change if the data is regenerated or edited.
Key SQL Analysis Findings
Overall Business Performance: The dataset recorded 382.77 million in revenue across 259,233 orders, with 49,751 distinct customers and 1.5 million units sold. The average order value was 1,476.56.
Top-Selling Products by Revenue: Gardena Garden Gloves Model 745 ranked first among the displayed products, generating 674,395 in revenue from 236 units sold.
Store Performance: Delhi Pitampura ranked highest among the displayed stores, generating 40.09 million in revenue from 2,671 orders. The leading stores showed broadly similar revenue and order volumes.
Returns Analysis: The dataset contained 30,000 return records associated with 29,251 distinct order items. The calculated returned-item-record rate was 4.88% of all order-item records.
Refund Analysis: Recorded refunds totalled 75.96 million.
0 likes · 2 views · Oct 22, 2026
Developed retail analytics dashboard using Python, SQL, and Power BI for comprehensive business insights.


