Power BI Data Analyst + ML AI Automation Expert
- 5.0
- Rating
- 114
- Followers
Power BI Data Analyst + ML AI Automation Expert
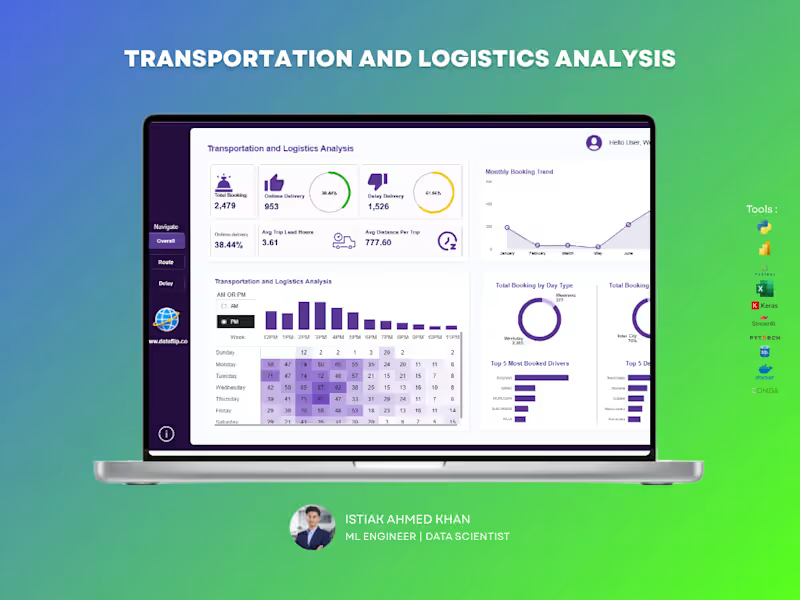
Managing logistics operations without clear insights can lead to delays, inefficiencies, and lost revenue. This dashboard is built to give you complete visibility into your transportation performance — all in one place.
A powerful analytics solution that helps you track bookings, delivery performance, delays, and operational efficiency in real time. Designed for clarity and speed, so you can make decisions without digging through raw data.
🔹Monitor on-time vs delayed deliveries instantly
🔹Track booking trends and operational workload over time
🔹Analyze trip efficiency with lead time and distance metrics
🔹Identify peak hours and demand patterns
🔹Evaluate top drivers and most frequent routes/destinations
🔹Compare weekday vs weekend performance
If you want a clean, professional dashboard that turns your logistics data into real operational insights, I can build a custom solution tailored to your business needs.
2
7
355
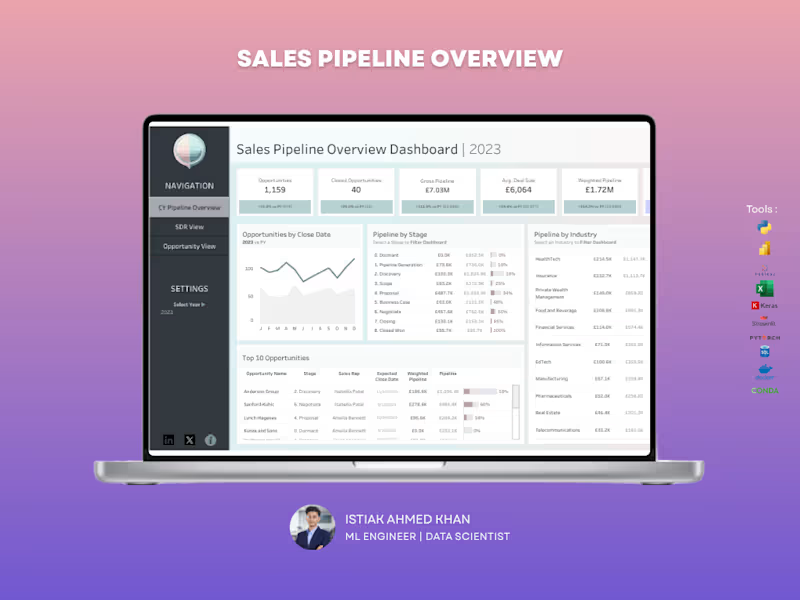
Sales Pipeline Dashboard – Tableau
Struggling to track your sales pipeline and forecast revenue accurately? This dashboard gives you a clear, real-time view of your entire sales funnel, helping you stay on top of opportunities and close deals faster.
What You Get
A centralized Tableau dashboard that brings together pipeline value, deal stages, and performance metrics into one intuitive view. No more scattered reports — everything you need is in one place.
Key Capabilities
Track total opportunities and closed deals
Monitor gross pipeline and weighted pipeline value
Analyze pipeline by sales stage to identify bottlenecks
Compare pipeline performance across industries
View top opportunities and deal progress
Understand average deal size and close trends
Why It Matters
Without visibility into your pipeline, it’s easy to miss opportunities and misjudge forecasts. This dashboard helps you identify stuck deals, improve conversion rates, and predict revenue more accurately.
Perfect For
Sales teams and managers
B2B companies
Startups scaling their sales process
Agencies managing multiple clients
Let’s Build Yours
If you want a high-impact Tableau dashboard that turns your sales data into actionable insights, I can create a custom solution tailored to your business.
4
11
471
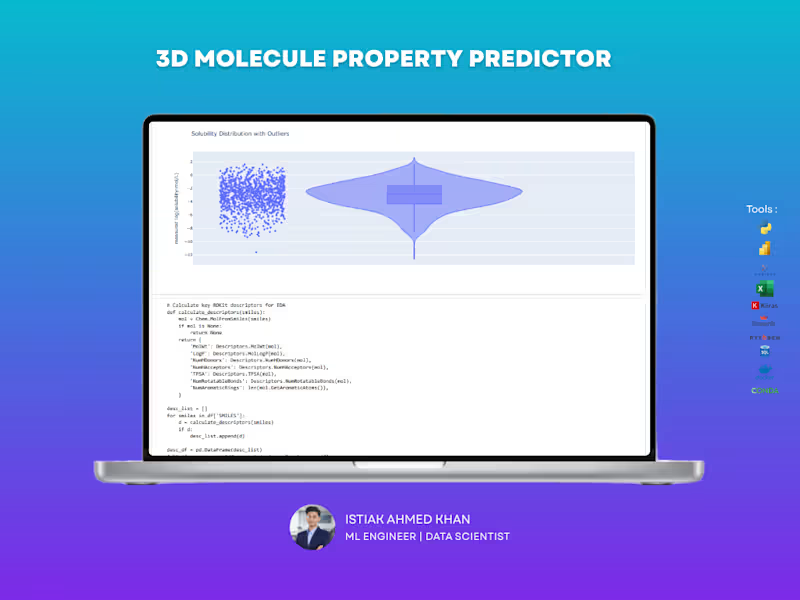
3D Molecular Intelligence: Accelerating Drug Discovery through Predictive Analytics
The Impact: This project addresses a critical bottleneck in pharmaceutical research: determining molecular solubility (logS). By replacing slow, expensive lab tests with high-precision machine learning, this system enables scientists to screen thousands of compounds in seconds, significantly reducing the cost and time required to bring new life-saving drugs to market.
Drastic Cost Reduction: The predictive pipeline reduces early-stage experimental screening costs by 70–90%, allowing research teams to focus resources on the most promising drug candidates.
High-Precision Forecasting: Utilizing a hybrid 3D feature engineering approach, the system achieves a remarkable 91.3% accuracy (R² score) in predicting solubility, providing a highly reliable alternative to physical testing.
Accelerated R&D Cycles: By automating the identification of viable molecules, the tool dramatically shortens the "hit-to-lead" time in pharma and materials science, getting products to market faster.
Empowering Researchers: I deployed a professional Streamlit dashboard featuring an interactive 3D molecular viewer. This allows non-technical chemists to visualize complex structures and make data-driven decisions without needing to write a single line of code
3
365
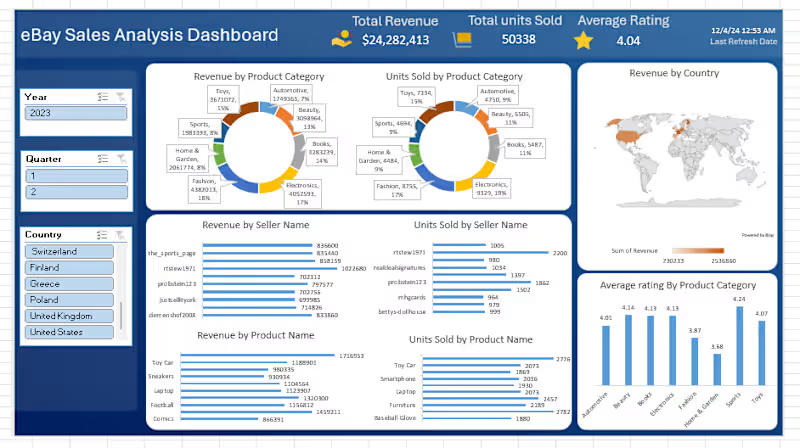
eBay Sales Analysis Dashboard in Microsoft Excel :
E-commerce platforms generate large volumes of transactional data, making it difficult to track performance across products, sellers, and regions. Without a centralized dashboard, identifying top-performing categories, understanding customer behavior, and monitoring sales trends becomes challenging.
Key Metrics
Total Revenue: $24.28M
Total Units Sold: 50,338
Average Rating: 4.04
These KPIs provide a quick snapshot of overall business performance and customer satisfaction.
Business Impact:
Identifies top-performing products and categories
Enhances seller performance evaluation
Improves market targeting and regional strategy
Supports data-driven pricing and inventory decisions
Tracks customer satisfaction for quality improvement
7
7
731

Data analyst | Python | SQL | Tableau | Excel | Power BI
Data analyst | Python | SQL | Tableau | Excel | Power BI


Data Analyst and Visualizers
Data Analyst and Visualizers



20+ Founders trust me for AI Product, AI UX & Agentic UX. ⚡
- 11
- Followers
20+ Founders trust me for AI Product, AI UX & Agentic UX. ⚡


Product Design Partner for SaaS & AI teams
Product Design Partner for SaaS & AI teams



AI/ML Developer helping businesses solve real-world problems
New to Contra
AI/ML Developer helping businesses solve real-world problems


Senior Visual & Product Designer | 3D Typography & UI/UX