Flight Data Scraping: Analysis and Visualizations in Tableau
Sadidul Kabir
Flight Data Scraping: Analysis and Visualizations in Tableau
Problem Statement
In this project, I used Selenium to scrape flight data from Google Flights, collecting details for flights from Dhaka to five major airports ("JFK", "LHR", "DXB", "JED", "SIN") over the next three months. The dataset includes fields like travel date, airline, duration, stoppage, and ticket price. After cleaning the data in pandas, I analyzed pricing trends, booking lead times, airline performance, and stoppage impact. Finally, I visualized key insights in a Tableau dashboard, including price trends, a booking strategy guide, and a map of destinations.
Data Source
Project Details
Introduction
The task of the project is I have to scrape a dynamic website with Selenium and build meaningful analytics and visualizations in a Tableau dashboard. To scrape data, I've selected a dynamic website named Google Flights. Google Flights is a flight search and booking aggregator website. It is a travel metasearch engine that allows users to search for flights, compare prices, and find travel deals across various airlines and booking platforms.
Data Scraping Process
To make data collection meaningful, I scheduled flights from Dhaka to 5 major airports. I want to collect the next 3 months of data. I selected the data column named ["scrape_date," "departure_from," "destination," "travel_date," "airline_name," "duration," "stoppage," "ticket_price_BDT"]. After running the script, I'm able to collect the data in a CSV file. I have 1,599 rows without any null values.
Data Cleaning
For data cleaning, I load the dataset in a pandas DataFrame. Convert columns to datetime, which needed that. Calculate the difference in travel_date and scrape_date; make an extra column named booking_before_days. In the stoppage column, replace 'Nonstop' with 0 and extract the numeric part. After cleaning, save the DataFrame to a CSV file named 'flight_data_processed.'
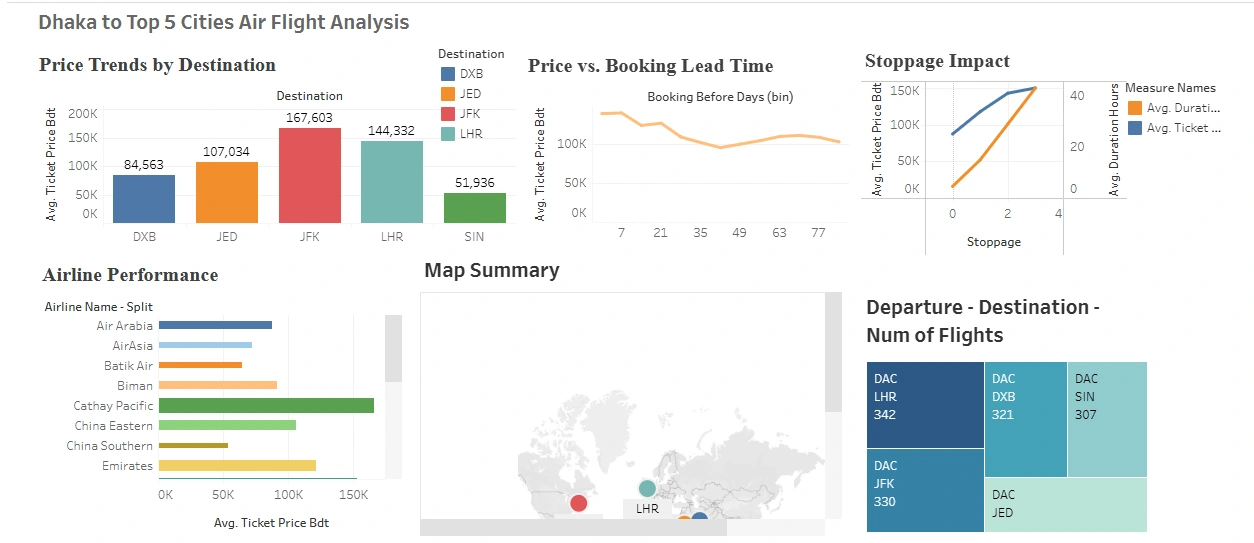
Key Insights
Price Trends by Destination: Here, I want to show avg. ticket price for each destination.
Price vs. Booking Lead Time: How prices change based on lead time. Best time to book flights for lowest fares.
Stoppage Impact:
When to choose non-stop flights: Business travel, time-sensitive trips.
When stopovers make sense: Budget travelers, flexible schedules.
Best strategies: Balancing price and travel comfort.
Airlines Performance: Is the airline budget-friendly or premium?
Map Summary: Want to show the destination point in a map.
Build From Source
Clone repo
Initialize virtual environment
Activate virtual environment
Install dependencies
First run
scrape_flight_data.py file for scraping dataFrom data folder
flights_data_scrape.csv is the original scraping data set.Then running
flights_data_cleaning.ipynb file you'll get the the processed data. Which is stored in data folder called flights_data_processed.csv.🛠️ Contributions
We welcome contributions! Feel free to fork the repository and submit a pull request.
📩 Contact
For any inquiries or collaborations:
GitHub: github.com/sadidul
LinkedIn: linkedin.com/in/md-sadidul-kabir
Email: msk.chanchal@gmail.com
🚀 Star this repo ⭐ if you find it useful!
Like this project
Posted May 4, 2025
Scraped and analyzed flight data, visualized insights in Tableau.
Likes
0
Views
9