
Denzel Gabriel Perez Yerena
Accounting & Finance Automation | Excel & VBA
New to Contra
Denzel Gabriel is ready for their next project!
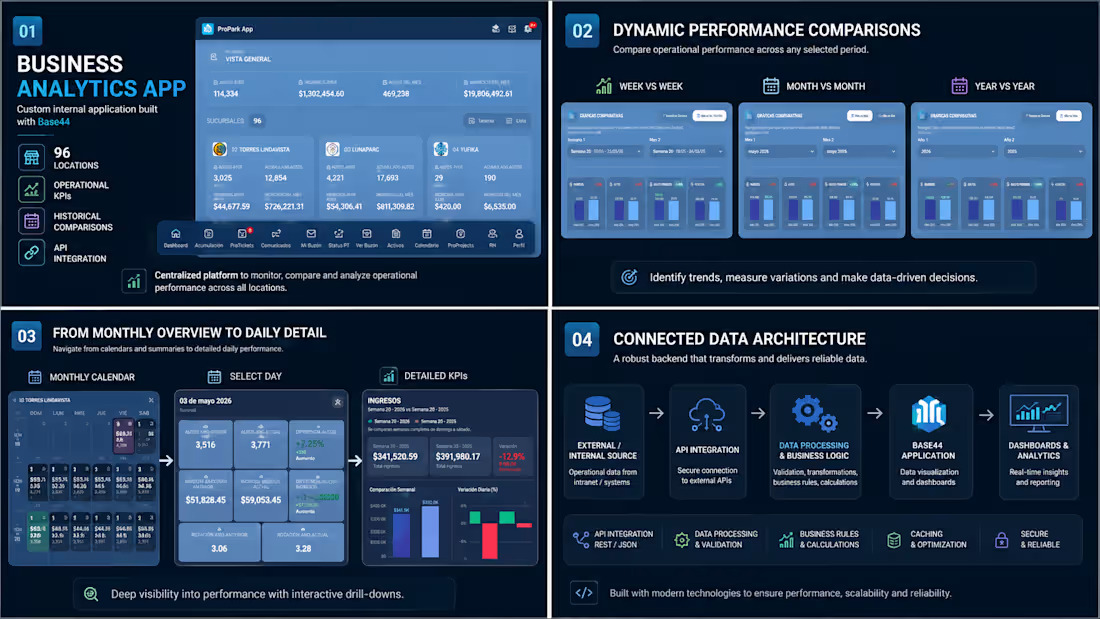
Custom internal application for multi-location operational analytics, historical comparisons and automated data processing.
I developed a custom business analytics application designed to centralize and analyze operational data across multiple locations.
The application transformed raw operational data into interactive dashboards where users could monitor revenue, transaction volume, average ticket, rotation and other key performance indicators.
It included dynamic Week-over-Week, Month-over-Month and Year-over-Year comparisons, historical performance views, daily and monthly analysis, location-level monitoring and detailed drill-down screens.
Behind the interface, the application incorporated business logic, data processing workflows and an API integration with an external internal system to retrieve and process operational information.
The objective was to replace fragmented data analysis with a centralized application that made operational performance easier to monitor, compare and understand.
Technologies & concepts: Base44 · API Integration · JavaScript · JSON · Data Processing · Business Logic · Dashboards · Data Visualization · Operational Analytics
This application is no longer publicly hosted. The screenshots shown are original development evidence from the project.
0
14
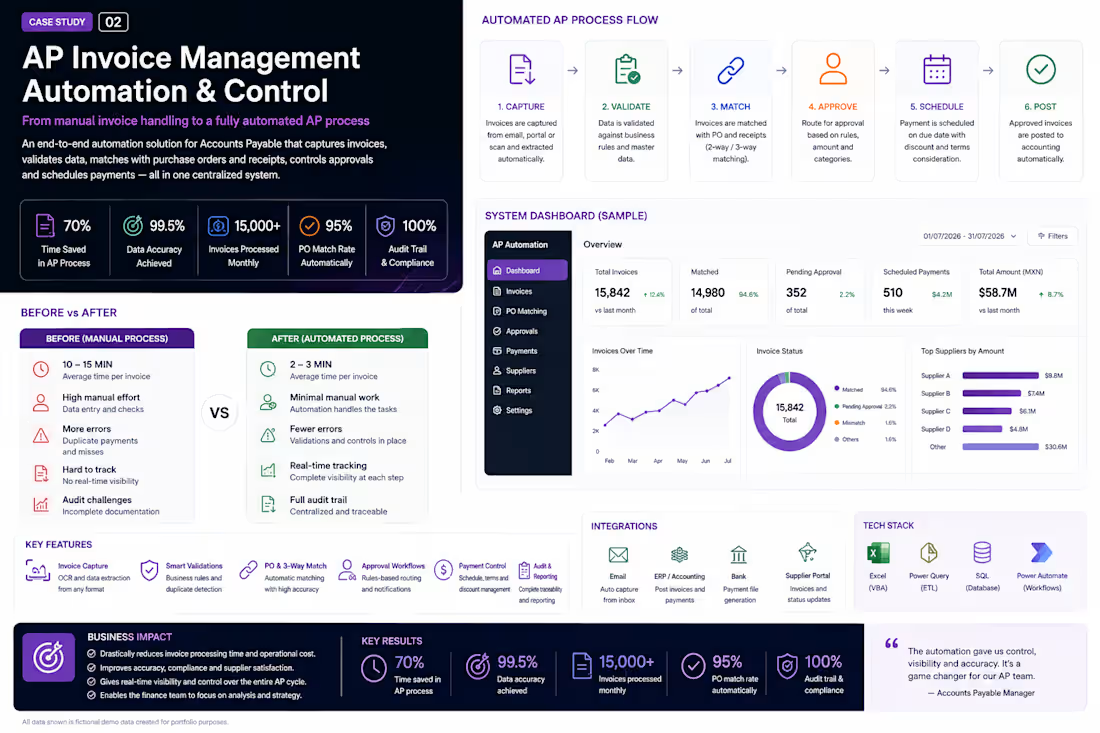
I designed a Business Intelligence and financial reporting solution that transforms scattered data from multiple sources into centralized, validated, and decision-ready information.
The solution automates the complete reporting workflow: connecting and consolidating data, cleaning and standardizing information, applying business rules, building a structured data model, calculating financial KPIs, and generating executive dashboards and recurring reports.
Instead of manually combining spreadsheets and preparing reports every reporting period, the workflow creates a repeatable data pipeline that reduces manual work while improving consistency, traceability, and visibility.
Key capabilities include:
Multi-source data consolidation
Automated ETL and data transformation
Data validation and quality controls
Power Pivot data modeling
Financial KPI calculations
Interactive executive dashboards
Automated and scheduled reporting
Exception and duplicate detection
Audit trails and process traceability
Technologies: Excel, Power Query, Power Pivot, VBA, DAX, SQL/CSV data sources and automated reporting workflows.
The goal of the project is not simply to create a dashboard, but to build the automated data process behind it — turning raw information into reliable insights that can support faster business decisions.
All information, companies and metrics displayed in this case study are fictional demo data created exclusively for portfolio purposes.
2
59
Executive Financial Dashboard & KPI Reporting Automation
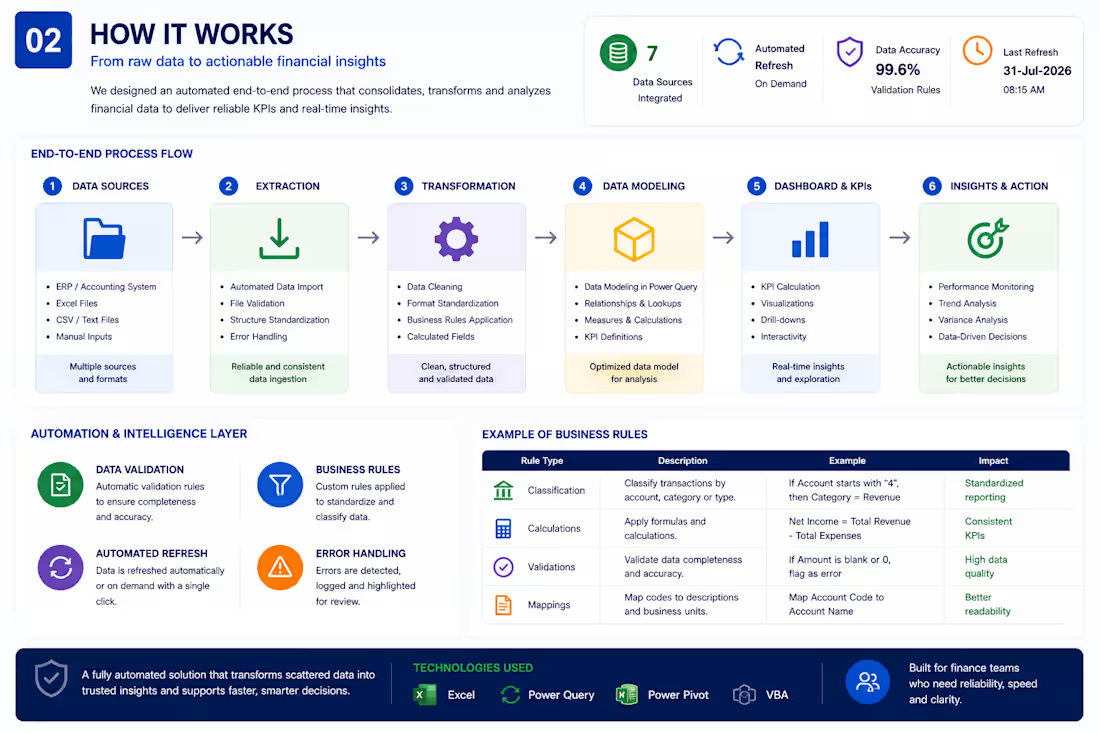
I designed an automated financial reporting solution that transforms scattered financial data into structured, reliable, and decision-ready insights.
The workflow consolidates information from multiple data sources, standardizes and validates the data, applies business rules and calculations, and automatically updates financial KPIs and executive dashboards.
The solution combines Excel, Power Query, Power Pivot, data modeling, and VBA automation to reduce repetitive reporting work and create a centralized view of financial performance.
Key capabilities include automated data consolidation, financial KPI calculation, data validation, exception detection, interactive reporting, trend analysis, and automated dashboard refreshes.
The project demonstrates how traditional spreadsheet-based reporting can be transformed into a more scalable and automated financial analysis system.
All information and metrics shown in the case study are fictional demo data created exclusively for portfolio purposes.
0
35
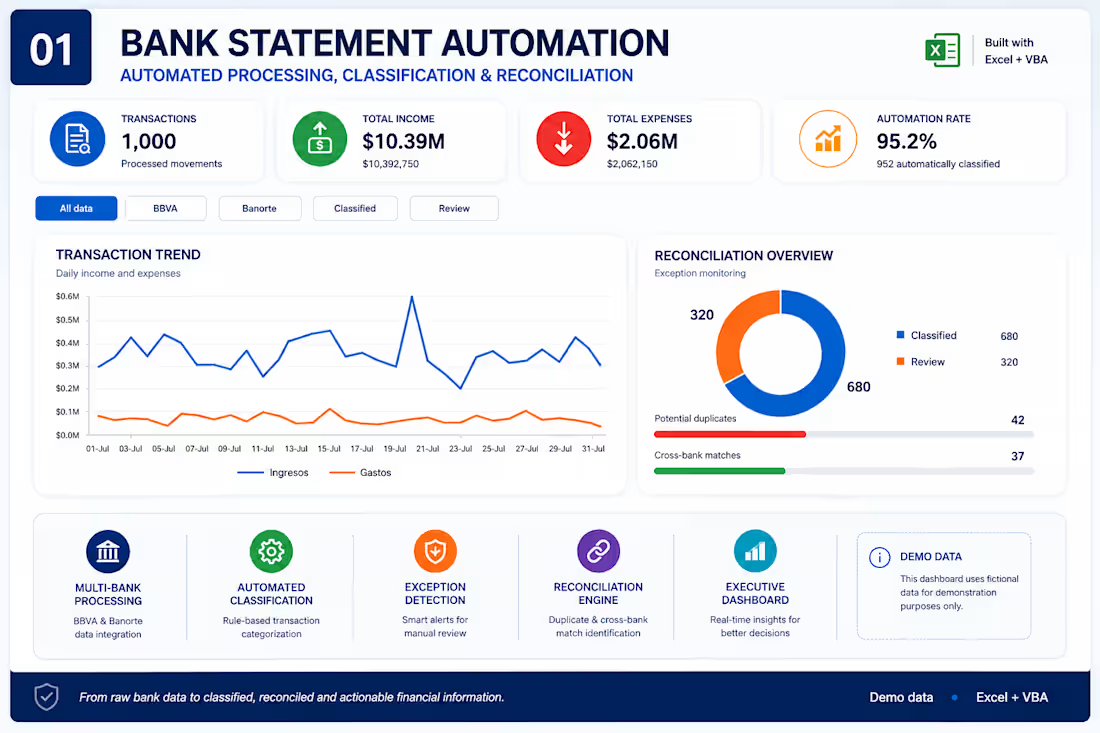
Bank Statement Processing & Reconciliation Automation
I built an Excel & VBA automation system designed to transform raw bank statement data into structured, review-ready financial information.
The workflow automatically processes transactions from multiple bank sources, identifies transaction types, applies configurable classification rules, detects branches and categories, flags exceptions for manual review, and performs reconciliation checks to identify potential duplicates and cross-bank matches.
I also developed an executive dashboard to provide a clear overview of transaction activity, income, expenses, classification status, and reconciliation alerts.
Key features: automated bank transaction processing, rule-based classification, exception detection, configurable business rules, duplicate detection, cross-bank reconciliation, and executive financial reporting.
The screenshots shown use fictional demo data created to demonstrate the workflow without exposing confidential financial information.
Built with Microsoft Excel + VBA.
0
38