The network for creativity
Join 1.25M professional creatives like you
Connect with clients, get discovered, and run your business 100% commission-free
Creatives on Contra have earned over $150M and we are just getting started
Back to feedPost

Hi, I’m Ameya 👋
I’m a Procurement & Operations professional who combines procurement expertise, data analytics, and technology to help businesses work smarter.
I specialize in strategic sourcing, vendor management, procurement operations, SAP MM, process improvement, data analysis, and reporting.
I enjoy turning complex processes into simple, efficient, and data-driven workflows — whether it’s improving procurement processes, building reports, managing vendors, or automating repetitive tasks.
🚀 Open to freelance, remote, and project-based opportunities.
Let’s build something efficient together.




Absolutely. Procurement generates a huge amount of valuable data, and combining procurement expertise with data analytics can improve cost control, supplier performance, forecasting, and decision-making.
Welcome chief
The network for creativity
Join 1.25M professional creatives like you
Connect with clients, get discovered, and run your business 100% commission-free
Creatives on Contra have earned over $150M and we are just getting started











Related posts

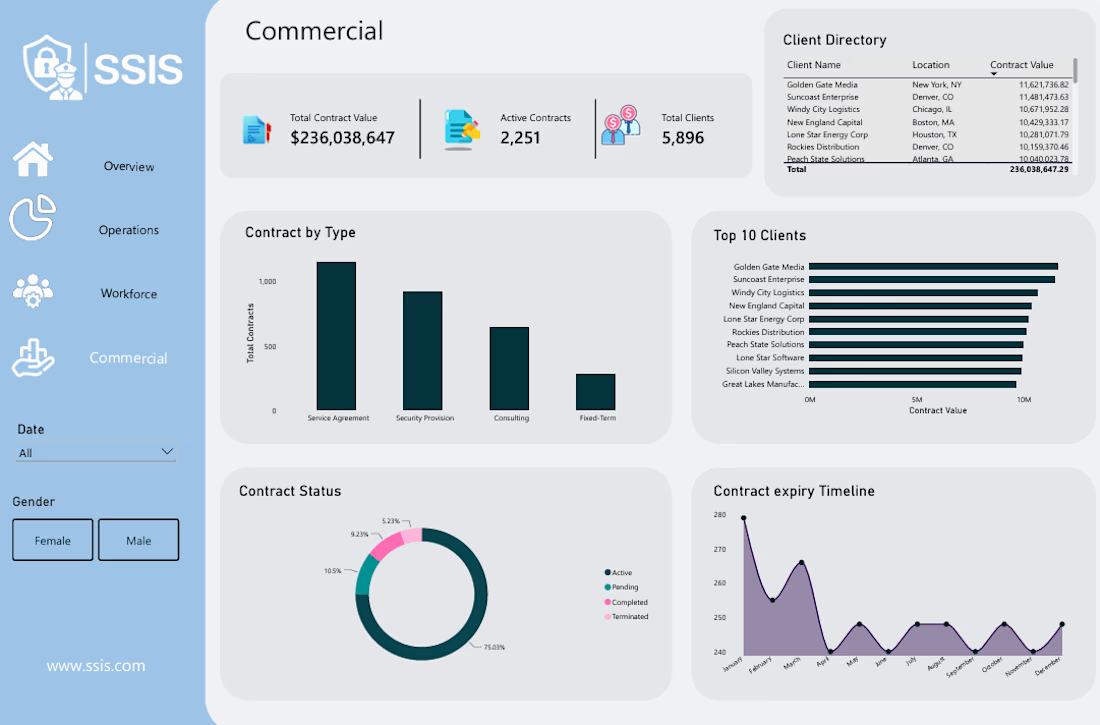
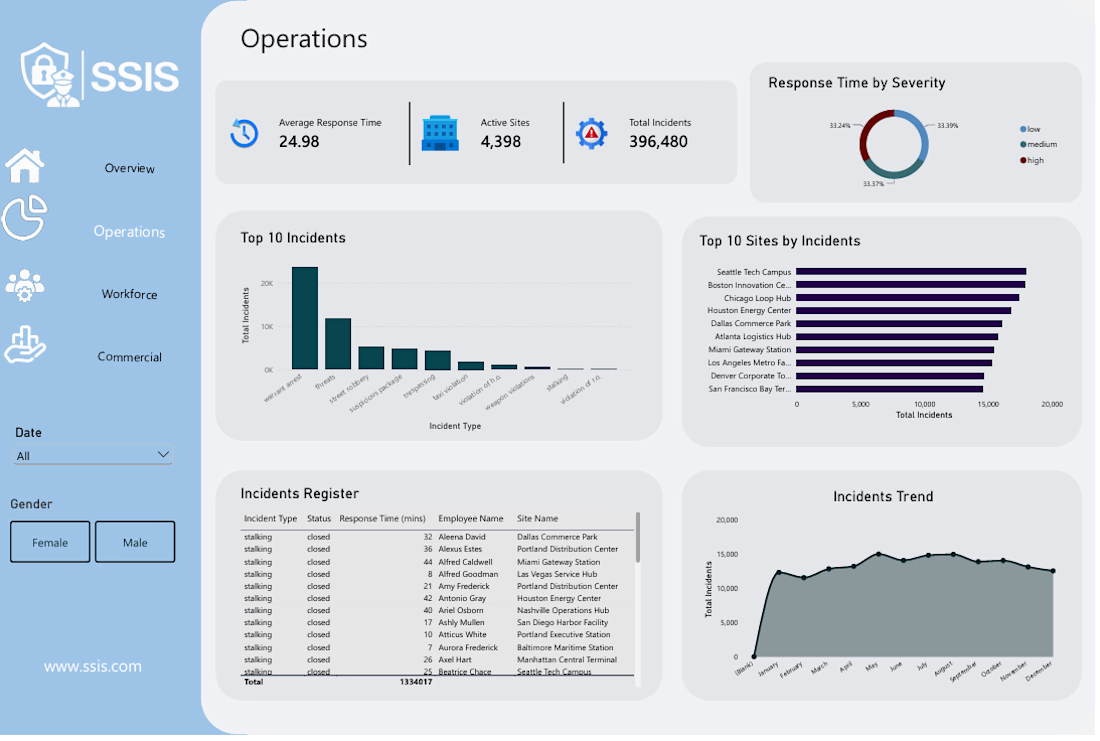
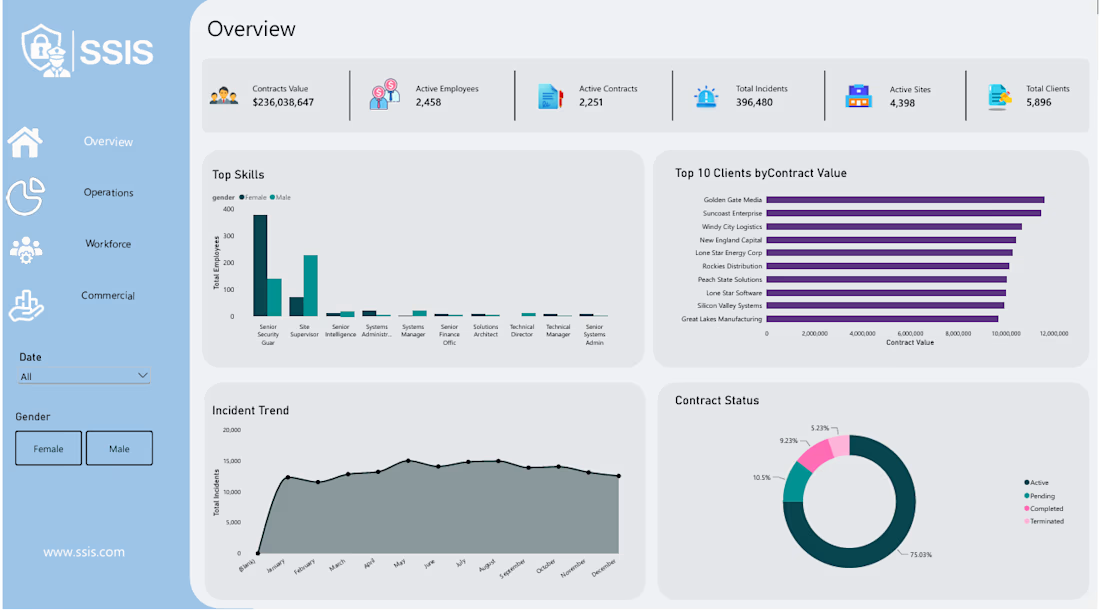
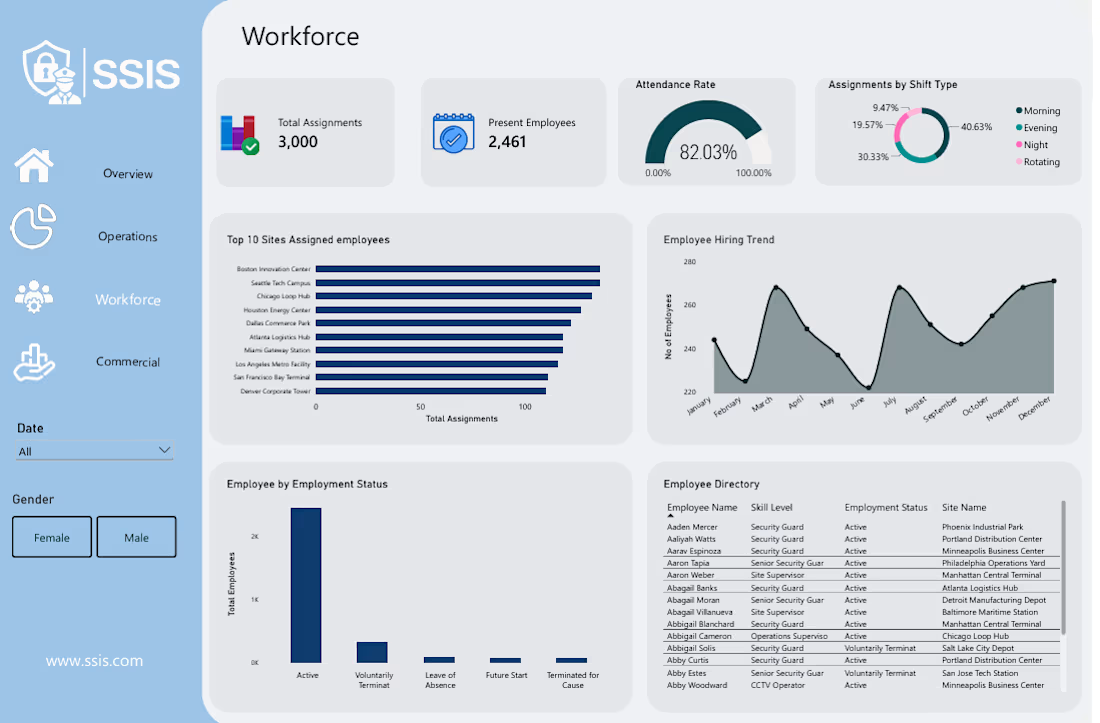
Security Support Information System
Developed an end-to-end Business Intelligence solution for the private security industry to improve operational visibility and decision-making. The project involved data cleaning and transformation using Python, relational database design in MySQL, SQL data management, and interactive dashboard development in Microsoft Power BI. The final solution consists of four dashboards covering Executive Overview, Workforce Analytics, Operations Analytics, and Commercial Analytics


Retail Inventory and Sales Analysis
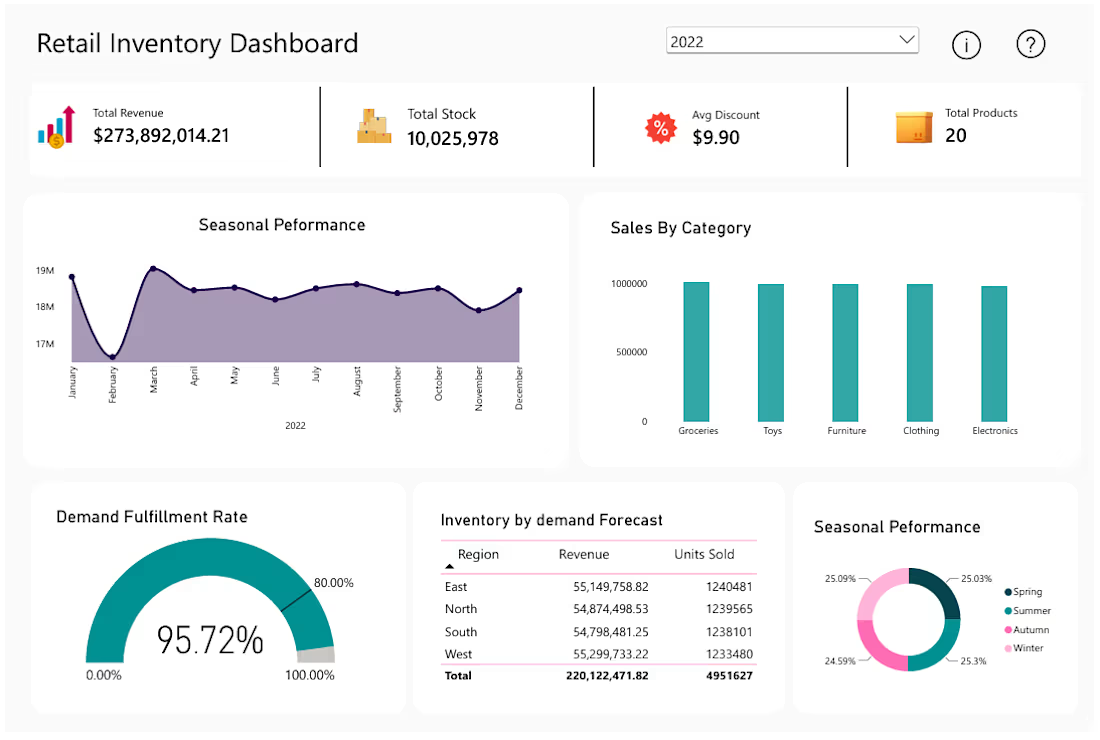
Retailers often collect large amounts of sales and inventory data but struggle to turn it into clear decisions around stock, demand, and revenue performance.
I built an end-to-end retail analytics solution using Python, MySQL, and Power BI. With Python and Pandas, I cleaned and prepared the raw dataset, handling missing values based on their business meaning rather than blindly replacing them. The data was then analyzed in MySQL to explore revenue, units sold, inventory, discounts, categories, regions, and seasonal performance.
The final result was an interactive Power BI dashboard designed for quick business monitoring. It includes KPI cards for revenue, total stock, demand fulfillment, total products, and average discount, alongside sales by category, monthly seasonal performance, regional revenue and units sold, inventory by demand forecast, and seasonal distribution.
Key findings included a 95.72% demand fulfillment rate, balanced sales across the five product categories, and a near-even distribution of performance across the four seasons. The dashboard also provides a clear view of regional sales and inventory relationships, helping identify where demand and stock performance may require further attention.

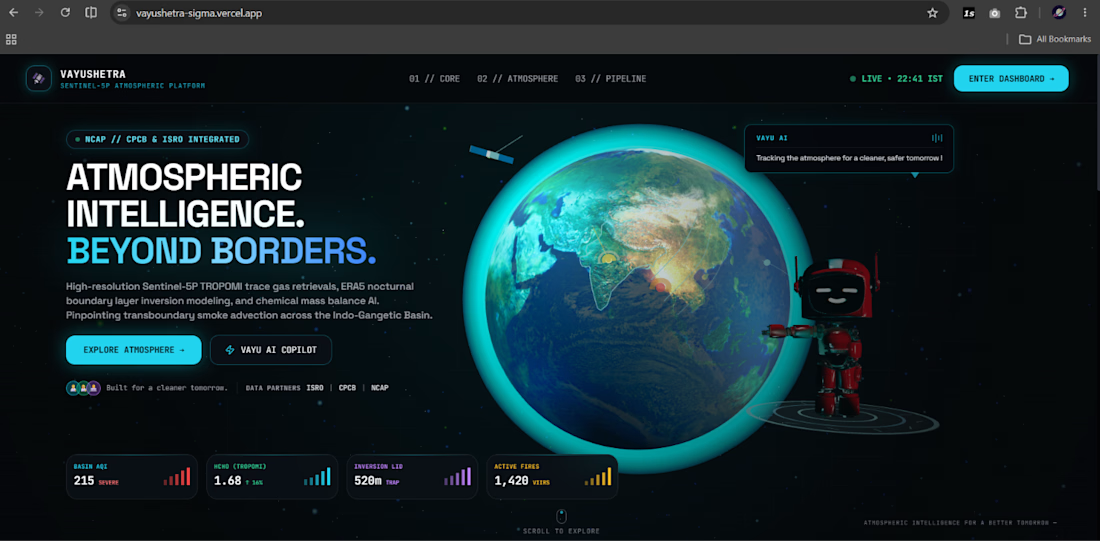
VayuShetra — AI-Powered Air Quality Intelligence & Early Warning System
VayuShetra is an AI-driven environmental intelligence platform designed to monitor air quality, analyze pollution patterns, and provide early warnings for potential air quality deterioration.
The project combines satellite observations, ground-based air quality data, weather conditions, and machine learning to identify pollution hotspots and forecast potential risks 48–72 hours in advance.
Key Features:
• AI-powered air quality prediction using LightGBM and XGBoost
• Satellite-based environmental monitoring using Sentinel-5P, NASA FIRMS, and MODIS data
• Wind-vector analysis and plume dispersion modeling
• Pollution hotspot detection using DBSCAN clustering
• Interactive geospatial visualization and early-warning insights
Tech Stack: Python, Machine Learning, LightGBM, XGBoost, Scikit-learn, Satellite Data Analysis, Geospatial Analytics, Weather APIs.
VayuShetra demonstrates how AI and environmental data can be combined to support smarter pollution monitoring and proactive decision-making.