The network for creativity
Join 1.25M professional creatives like you
Connect with clients, get discovered, and run your business 100% commission-free
Creatives on Contra have earned over $150M and we are just getting started
Back to feedPost

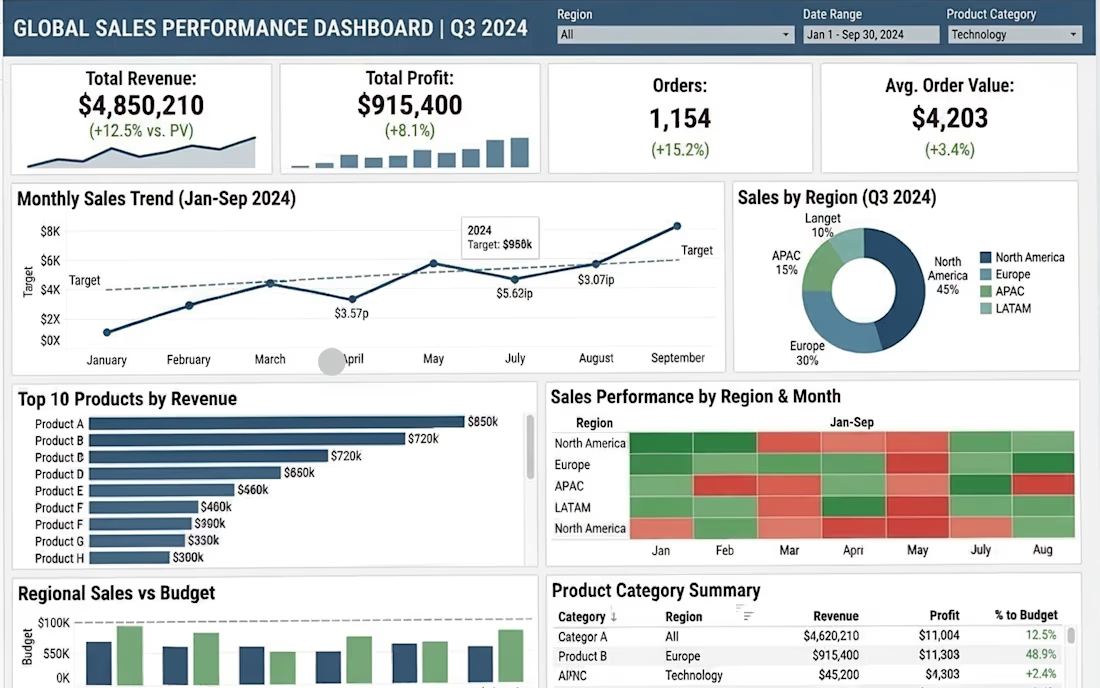
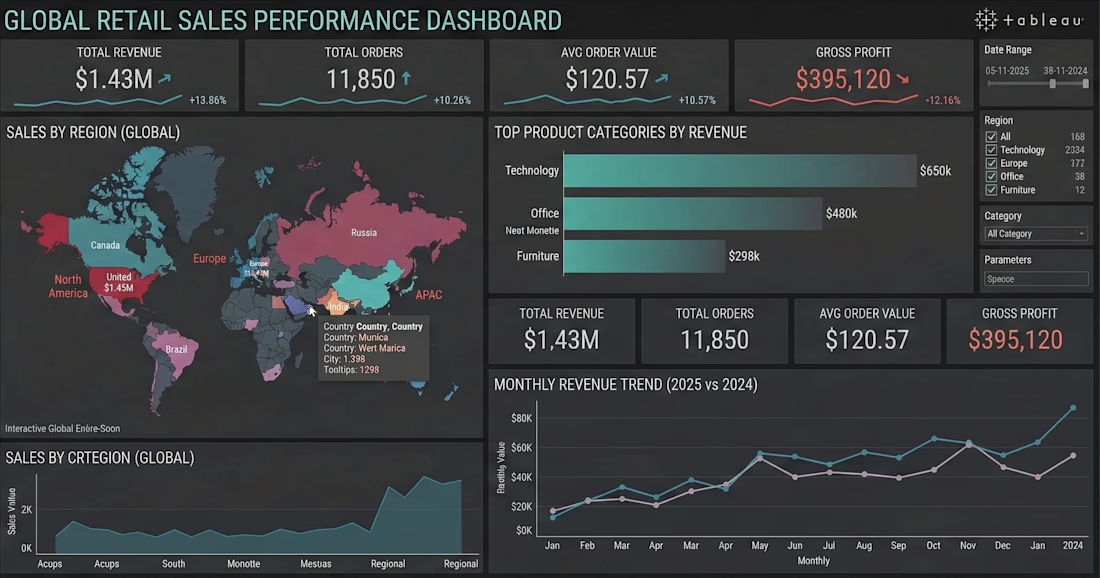
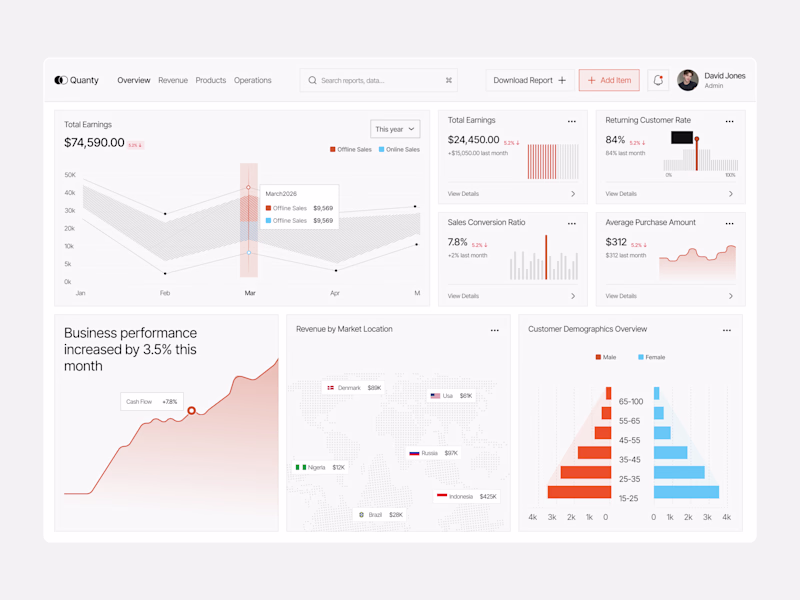
Interactive Global Retail Sales Dashboard
I designed and developed this interactive data visualization dashboard to transform raw global retail data into a clear, actionable business intelligence tool.
Instead of relying on static spreadsheets, executive stakeholders can use this dashboard to instantly view high level KPIs. This centralized visualization helps management identify top-performing sectors, track seasonal trends, and drive data informed strategic decisions.
Key Features & Tech Stack:
Tableau for advanced data visualization and interactive dashboard design
Geospatial Analysis for mapping global sales distributions
Dynamic Filtering for custom date ranges, regions, and product categories
Business Intelligence & Data Analytics for accurate KPI tracking


The network for creativity
Join 1.25M professional creatives like you
Connect with clients, get discovered, and run your business 100% commission-free
Creatives on Contra have earned over $150M and we are just getting started
Related posts

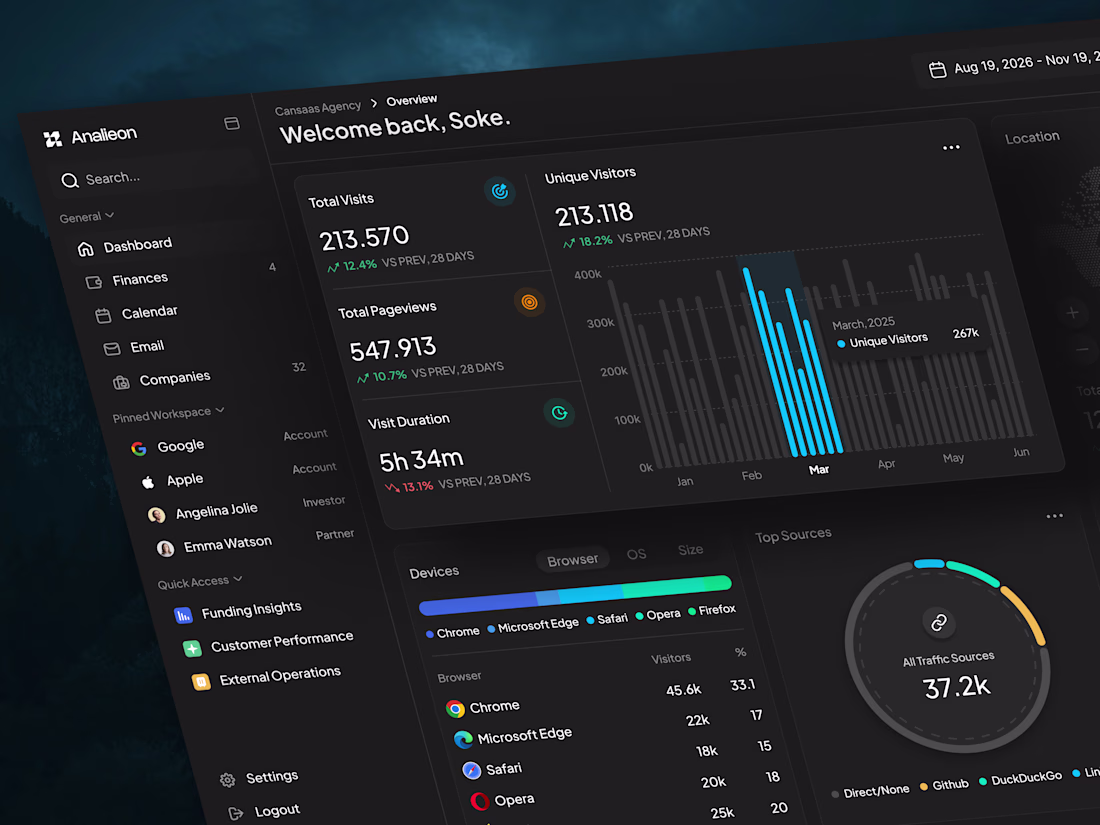
This analytics dashboard concept focuses on simplifying how teams monitor performance, user behavior, and traffic insights in one unified SaaS interface. By combining clean data cards, interactive charts, and visualized traffic sources, the dashboard helps users quickly understand trends, track engagement metrics, and explore analytics without feeling overwhelmed.
📩 Collaborate with Us? Contra Cansaas Agency

top class work


Data Analytics, Data entry, Web developer, Designer and Storyteller


Trending
aivideo
AI video tools are moving at warp speed. Which ones are you experimenting with?
returntonature
Spring is a reset for creativity. What’s inspiring you outside the screen right now?
aidesignflow
AI tools are redefining design work. What's your current workflow?
freelancerlife
Freelancer life is wins, pivots, and everything in between. What’s yours right now?
allthingsmetal
Metal is having a design moment – from chrome to gates and grates. What designs are you forging?