The network for creativity
Join 1.25M professional creatives like you
Connect with clients, get discovered, and run your business 100% commission-free
Creatives on Contra have earned over $150M and we are just getting started
Back to feedPost

Niche: Online Maker Software
Platform: Webflow
📌 The client had limited resources and no clear vision for their website or service. Using the resources provided, I designed the first UI design based on their needs. The client was impressed with the design, which laid a solid foundation for the project—even before it was ordered.
📌 Development Phase: Once the layout was complete, we started building the website using Webflow. The customers asked for examples to help showcase their service, so we added demo sections for different use cases then we have created a simple and functional Maker Software website.
📌 Website Optimization Features: My clients' basic features included a get-quote function, speed optimization, and on-page SEO work.


The network for creativity
Join 1.25M professional creatives like you
Connect with clients, get discovered, and run your business 100% commission-free
Creatives on Contra have earned over $150M and we are just getting started



Related posts

Crypto Portfolio Dashboard
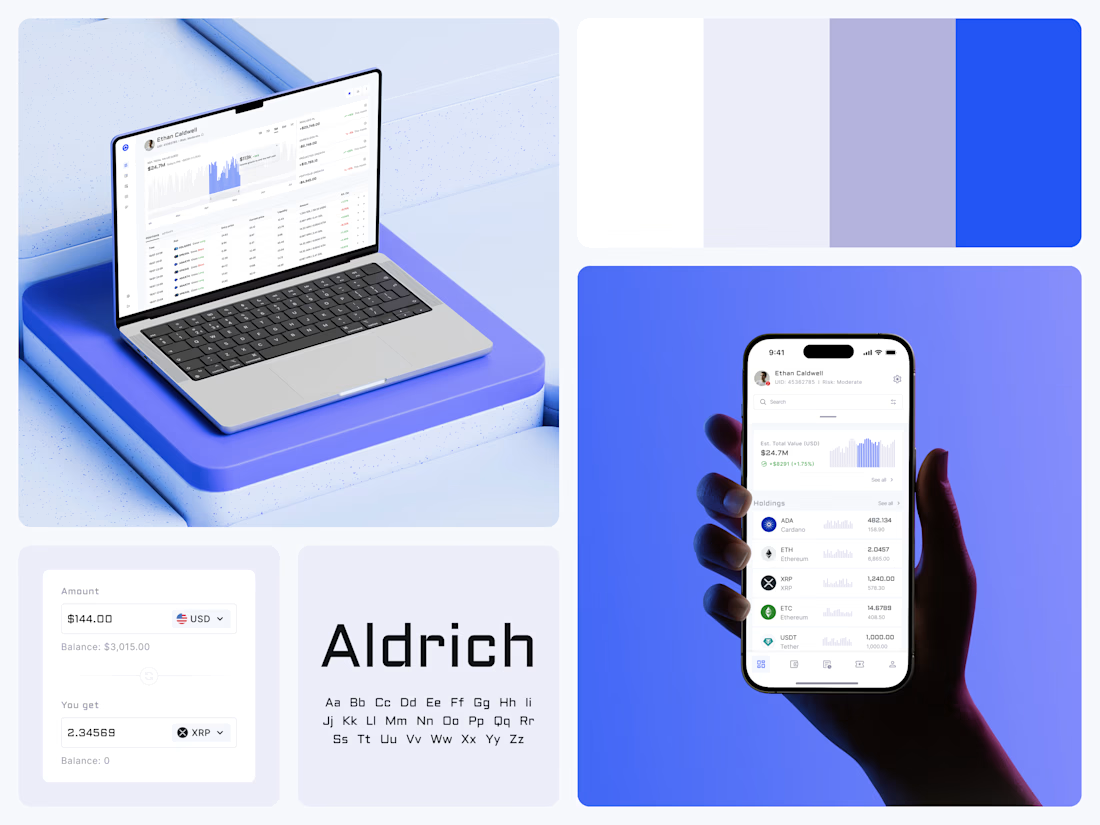
Blue means one thing here: the range you are looking at.
The value chart is a row of thin gray bars, and only the selected date range fills in blue. You read the period that matters and keep the months around it as context.
The phone carries the same chart above the holdings list. Each coin gets its own small bar chart between the name and the amount, so you can scan the whole portfolio for movement without opening a single coin.
Trading screens get busy fast. This one stays light and calm, so the numbers lead: total value, realized and unrealized P&L and open positions, all on one screen.
Designed by the Hue & Machine team.
#Crypto #Fintech #DashboardDesign #TradingPlatform #DataVisualization #UIDesign #ProductDesign #WebApp #MobileDesign #FigmaDesign



Nice Ui Dmytro


Looks great! What about readability though?
Text seems low contrast to me. Although I have a poor vision and most things seem too small and low contrast to me.


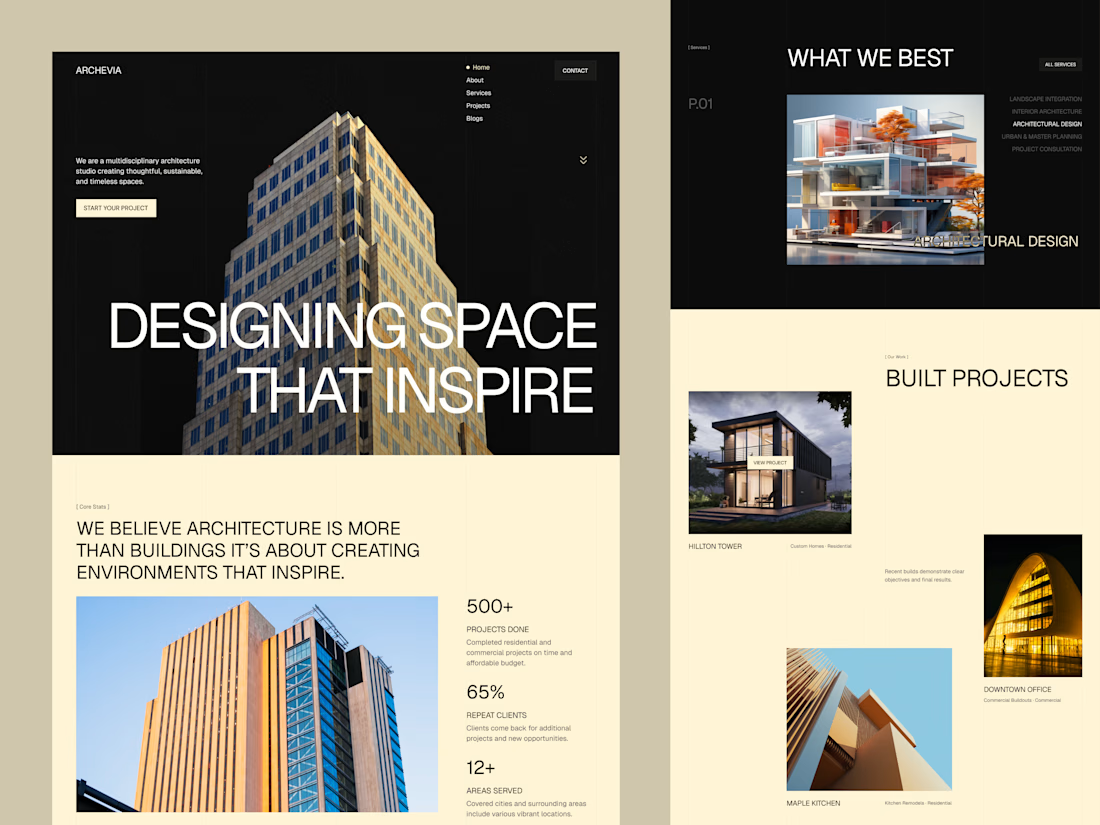
Archevia, Architecture & Design Website Template.
An editorial-style template built for architecture studios.
It features a CMS-powered project portfolio, service pages, testimonials, a contact form, and a blog.
Archevia is a device-friendly template with gallery-first layouts.
This is perfect for visual storytelling for design-led studios.
Check the comment.


nice work