The network for creativity
Join 1.25M professional creatives like you
Connect with clients, get discovered, and run your business 100% commission-free
Creatives on Contra have earned over $150M and we are just getting started
Back to feedPost
Quantix – AI Analytics Dashboard Design ||
Quantix is a comprehensive dashboard for monitoring LLM applications, providing real-time insights into performance, costs, token usage, and geographic request distribution. The design balances clarity with a modern look, using warm orange accents to highlight key metrics.
Key Features:
Real-time cost tracking with historical comparison
Geographic request distribution
Token usage with latency and throughput metrics
Custom date range filtering (Feb–Mar 2025)
Multi-dimensional charts with benchmark overlays
Problem Solved: LLM applications produce complex, multi-dimensional data. Quantix consolidates this into a single, intuitive interface, helping teams spot cost anomalies, performance bottlenecks, and usage trends quickly—removing the need for multiple tools or manual reports.
This is a very thoughtful balance of engineering clarity and product design. Consolidating cost, token usage, latency, and geo-distribution into a single, decision-ready view is exactly what LLM teams need as systems scale.
The warm accent strategy works well—it draws attention...
The network for creativity
Join 1.25M professional creatives like you
Connect with clients, get discovered, and run your business 100% commission-free
Creatives on Contra have earned over $150M and we are just getting started
Related posts
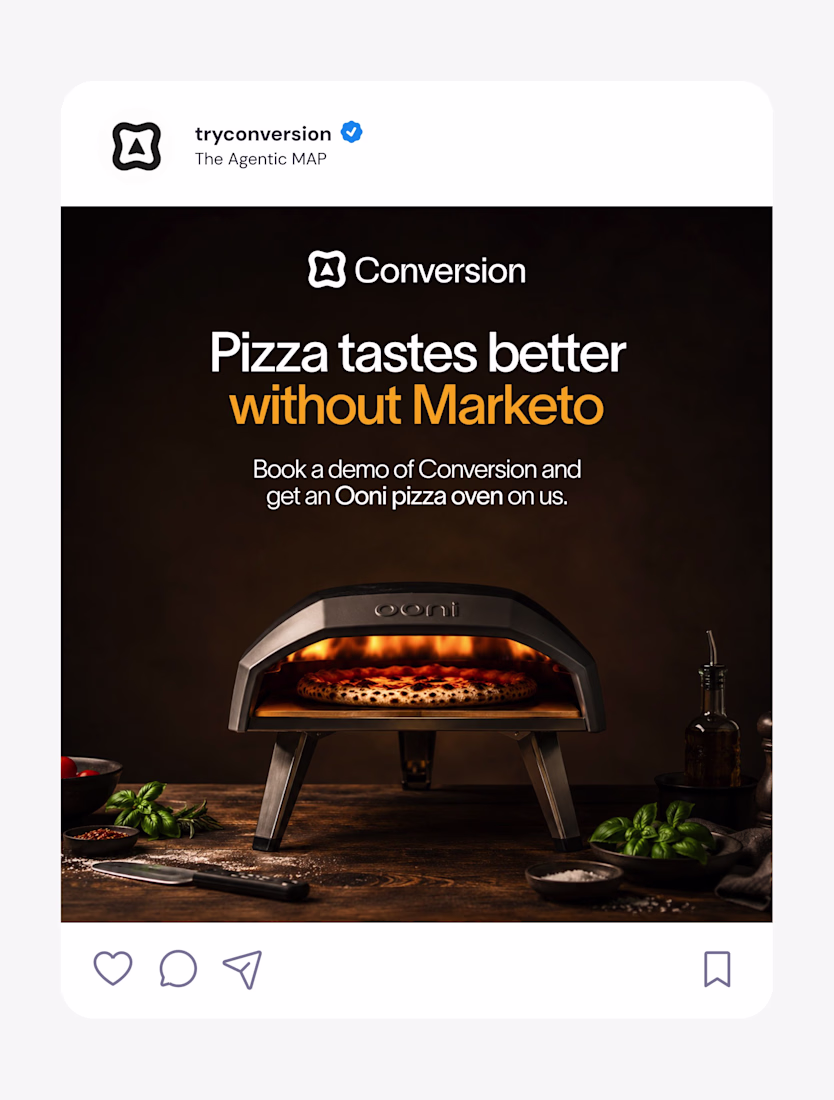
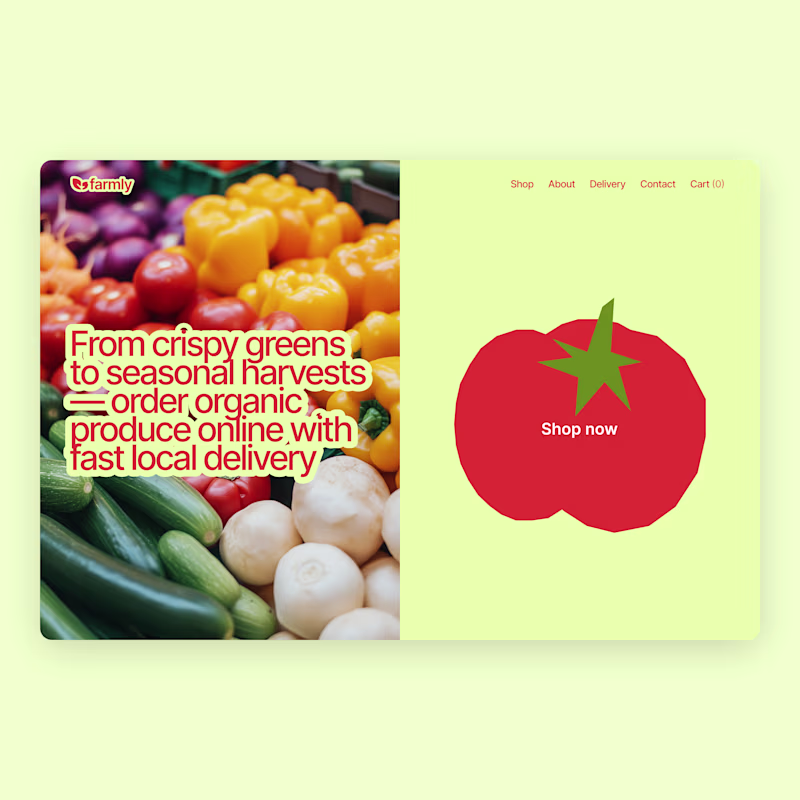
recent static ad work for an AI-native B2B marketing automation platform
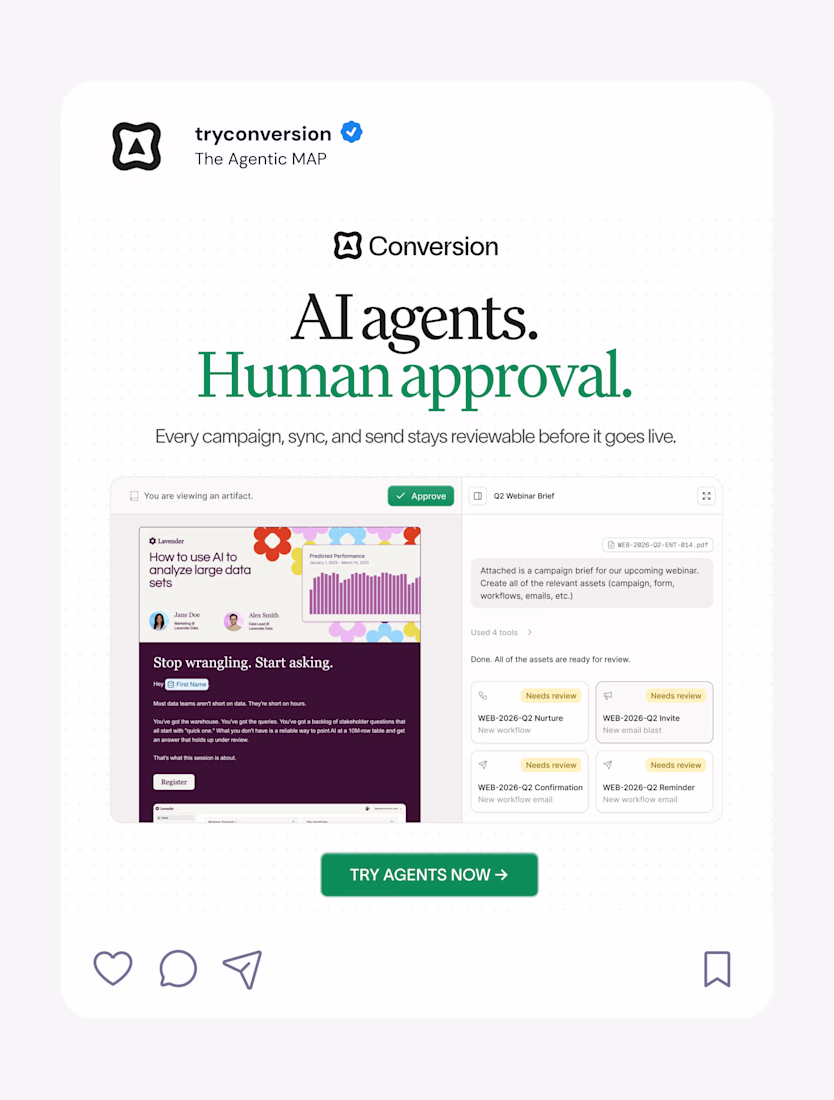
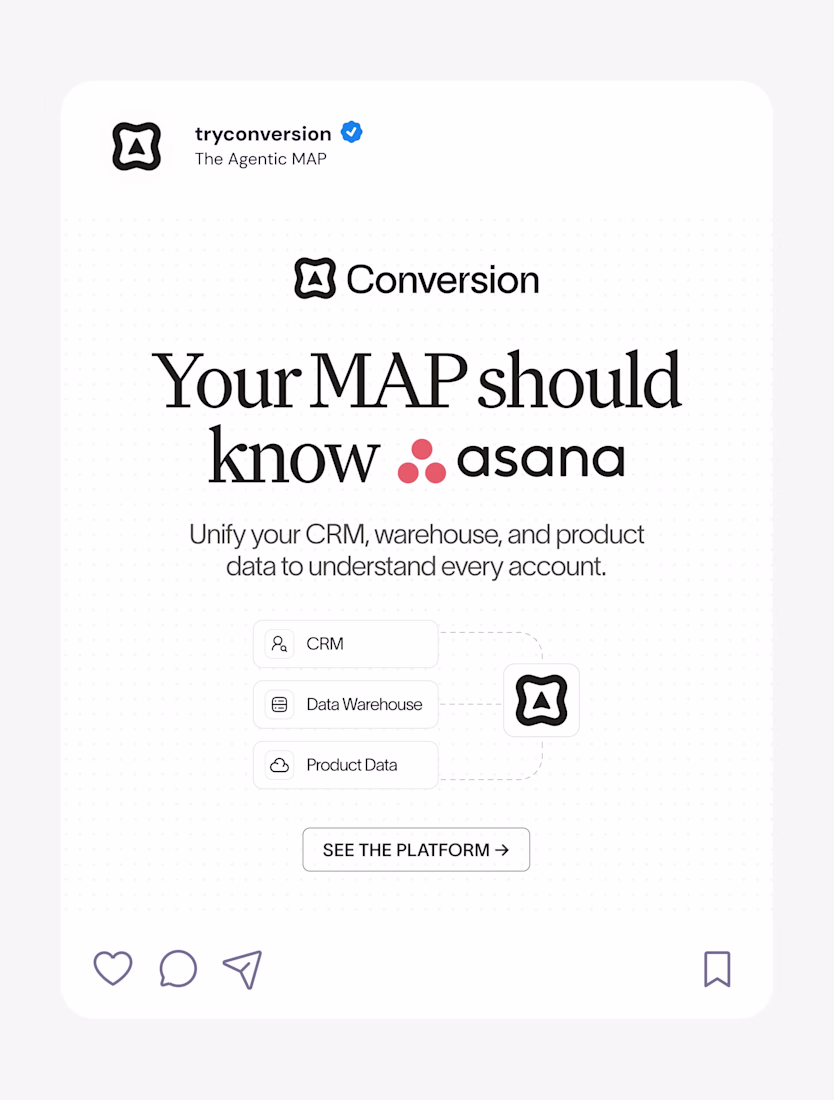
Nice work as usual! The layout balance here is exactly what makes high-converting landing page hero sections work.
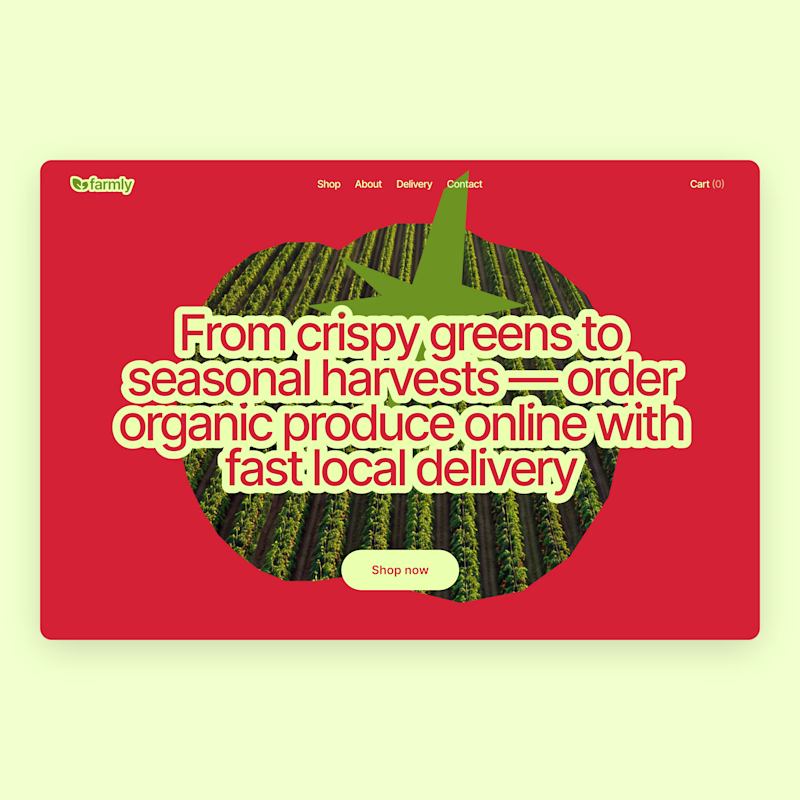
I already shared the first concept a few days ago, but I couldn’t stop exploring 😅
So here’s an alternative direction.
Which one would you pick?
Vote below 👇
75 voted
63%
45 voted
37%
120 votes
Closed
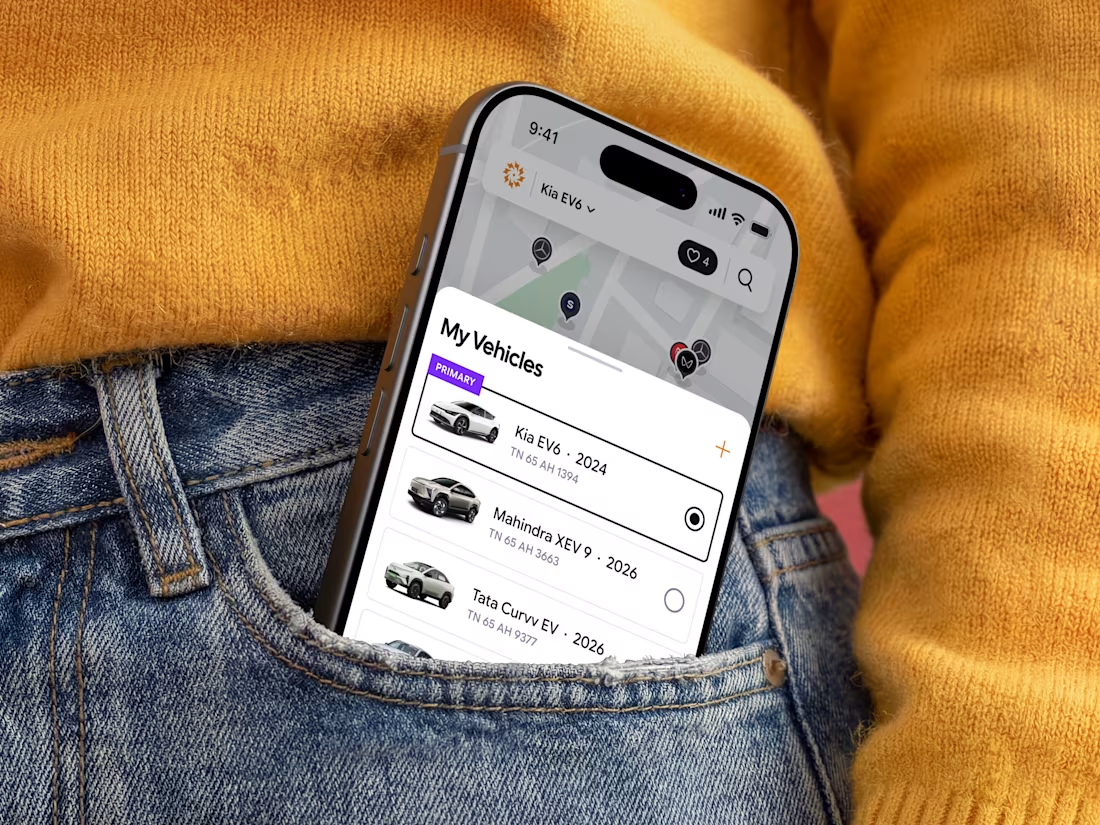
⚡ Just published my latest case study: ChargeIndia.
Branding and Mobile app for an EV charging platform focused on creating a seamless, scalable, and user-friendly charging experience.
Proudly made for the Indian market.
Amazing work!
Trending
Claude
Claude has entered the design space. How are you using Claude Design?
Contra University
Learn from expert creatives how to earn more using next-gen AI tools.
creativeaiflow
Creative AI workflows are evolving. What tools do you use, and what are their strengths and weaknesses?
freelancerlife
Freelancer life is wins, pivots, and everything in between. What’s yours right now?