The network for creativity
Join 1.25M professional creatives like you
Connect with clients, get discovered, and run your business 100% commission-free
Creatives on Contra have earned over $150M and we are just getting started
Back to feedPost

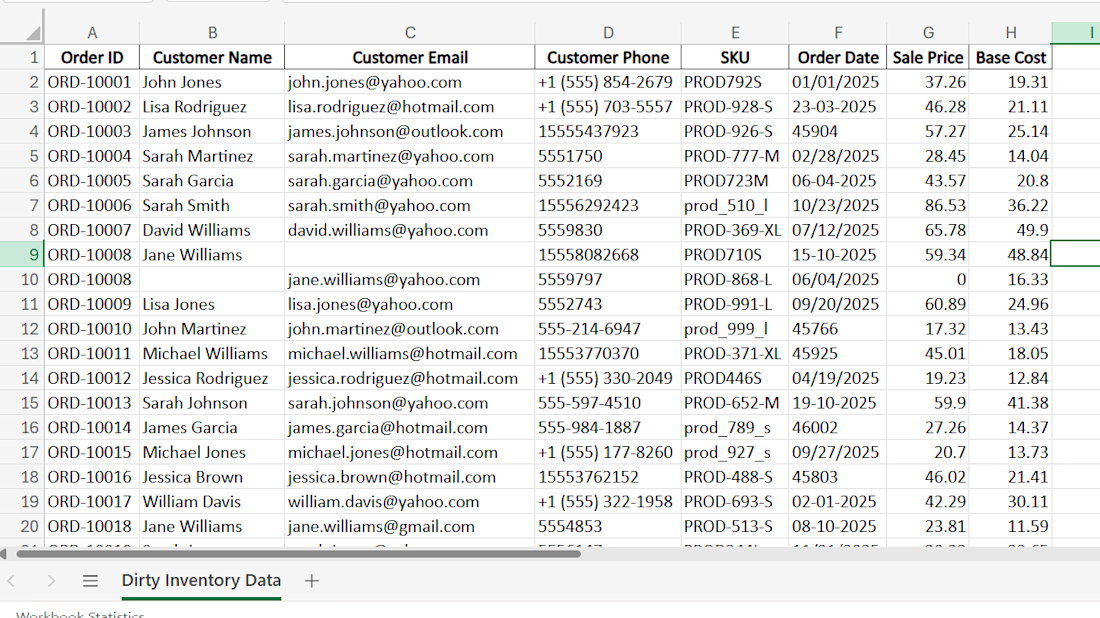
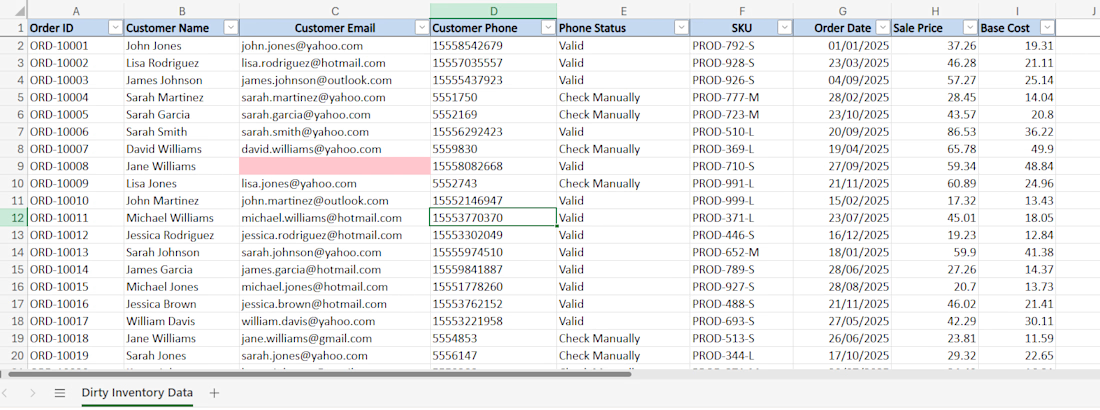
Just wrapped up an exciting data cleaning project for an e-commerce . The client’s inventory software and shipping provider had a syncing error, leaving them with over 4,400 rows of absolute chaos.
The Challenges I Solved:
Duplicate Orders: Merged 306 duplicate split order IDs where names and emails were scattered across separate rows.
Corrupted SKUs: Standardized mixed-case and broken SKUs (like prod_789_m and PROD789M) into a uniform PROD-XXX-X format.
Dirty Phone Numbers: Cleaned up messy contact strings containing country codes, hyphens, and spaces into a crisp, 10-digit format for their shipping system.
Date Formatting: Resolved a critical mix of MM/DD/YYYY, DD-MM-YYYY, and raw Excel serial numbers.
The Result: Delivered a pristine, software-ready Master Sheet along with a detailed "Changes Log" tab.
📥 Need your messy Excel or CSV files cleaned before your next big analysis or system migration? Shoot me a DM or invite me to your project! #dataanalyst #datacleaning #excel #dataformatting #dataprocessing

The network for creativity
Join 1.25M professional creatives like you
Connect with clients, get discovered, and run your business 100% commission-free
Creatives on Contra have earned over $150M and we are just getting started







Related posts

One business problem. Three analytical routes. One data-driven story. ☕📊
I turned raw business data into actionable decisions—not just another Power BI dashboard.
For the Onyx Data October 2026 Challenge, I worked on the Sunrise Coffee Chain analytics project, analyzing store performance, profitability, customer loyalty, revenue mix, and trading patterns across 60 UK stores (2023–2024).
🔹 My Analytical Approach
1️⃣ Python — Data Preparation
Cleaned and prepared the source datasets to establish a reliable foundation for analysis.
2️⃣ SQL — Business Analysis
Investigated store-level profitability, cost pressure, customer loyalty, revenue contribution, and trading patterns.
3️⃣ Power BI — Interactive Dashboards
Built a 3-page interactive report featuring advanced DAX measures, KPI cards, YoY comparisons, profitability analysis, and business-focused visualizations.
📊 Key Findings
• £89.7M Revenue | £16.9M Net Profit
The business recorded an aggregate net profit margin of 18.8% across the analysis period.
• Store Location Matters
Transport-Hub stores achieved a 25.1% aggregate net profit margin, compared with 18.6% for High-Street stores.
• An Area Requiring Attention
South London Corner recorded a £50.5K net loss over 24 months.
• Product Revenue Contribution
Espresso contributed 45.7% of daily revenue, while food contributed 26.1%.
• Trading Patterns
Average daily revenue was approximately 24% lower on weekends and 33% lower on UK bank holidays than on regular trading days.
💡 My Biggest Takeaway
Revenue alone does not tell the whole story. Understanding profitability, cost pressure, product contribution, and trading patterns helps businesses identify where to improve performance and make better decisions.
🔗 Explore the Complete Project
GitHub: https://github.com/SajeebTheAnalyst/sunrise-coffee-chain-analytics
If you were advising the management team, which finding would you investigate first—and why?
#DataAnalytics #SQL #PowerBI #Python #DAX #BusinessIntelligence #DataVisualization #OnyxData


I would investigate South London Corner first. Break the 24-month loss into store-month revenue, direct costs and allocated costs, then compare it with similar stores over matched trading periods. Reconcile at store-month grain before joining product or loyalty tables so a...

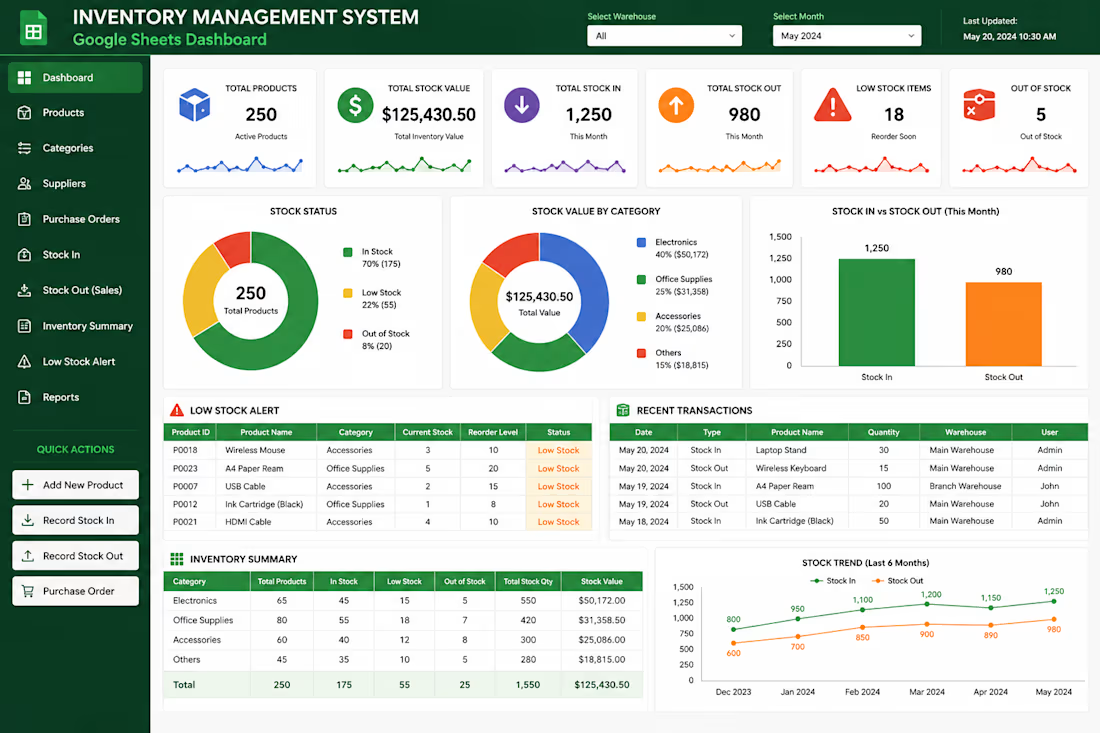
I developed an Excel-based inventory management solution to organize product records, monitor stock levels, and simplify inventory tracking. The system helps users maintain structured data, review stock information, and improve day-to-day inventory management through spreadsheet automation and clear reporting.


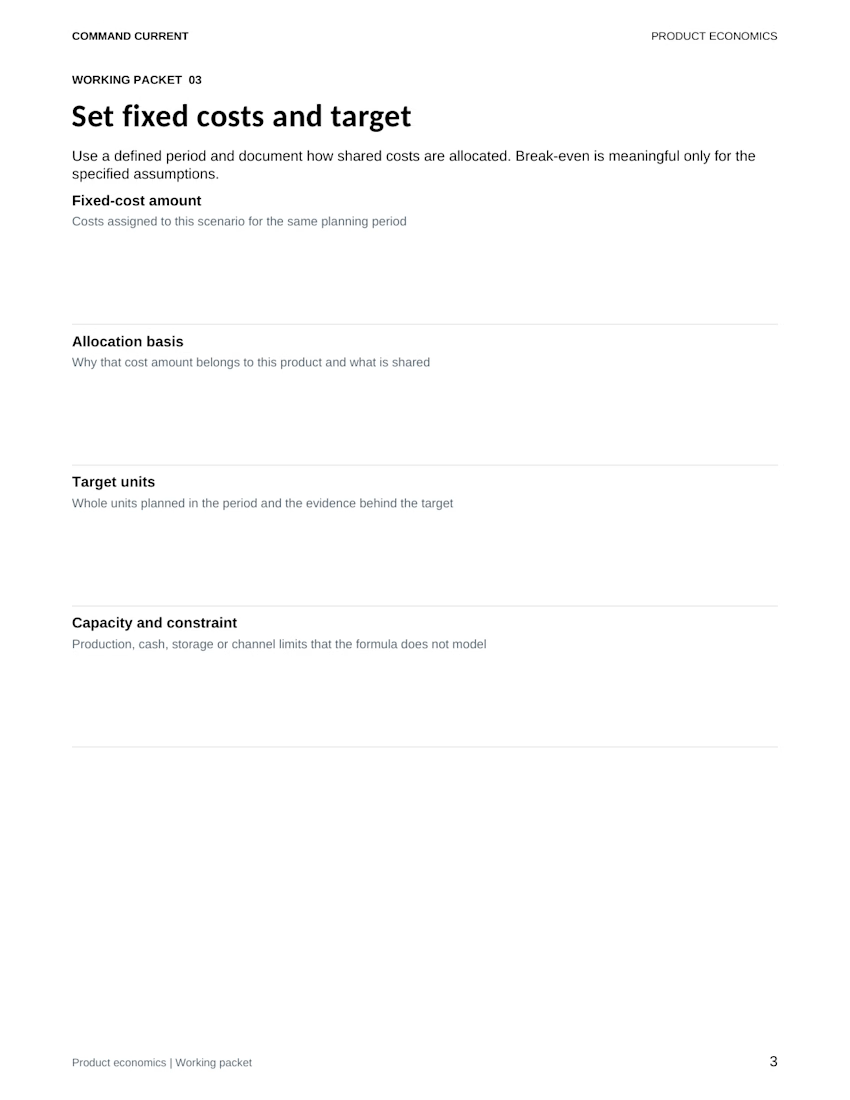
Two pricing scenarios can include the same studio overhead. Adding their break-even volumes together can double-count the costs they are meant to cover.
The Product Unit Economics and Break Even Kit keeps one product, channel and planning period per scenario. Its fictional desk-tray example assigns USD 1,800 in monthly studio and operating overhead to a 200-unit planning target.
Before comparing that row with another option, write down:
• Which overhead is assigned, and why
• Whether another scenario includes the same costs
• What supports the target volume
• Which production, cash or storage limits need a separate check
For example, comparing direct online sales with a wholesale option calls for separate price, fee and cost assumptions. Treat them as alternatives until you have a properly allocated combined model. A target entered in a spreadsheet is still a planning input, not evidence of demand.
The preview is the kit's actual fixed-cost and target worksheet. The download includes a five-page editable Word packet, an Excel scenario workbook, printable PDFs, a fictional completed example and a Quick Start. Built for desktop Word and Excel.
The example uses invented inputs. This simplified manual tool doesn't establish taxable profit, cash sufficiency or an appropriate selling price; consequential decisions need relevant professional review.
Get the digital kit: https://contra.com/payment-link/jF9ueVXt-product-unit-economics-and-break-even-kit