The network for creativity
Join 1.25M professional creatives like you
Connect with clients, get discovered, and run your business 100% commission-free
Creatives on Contra have earned over $150M and we are just getting started
Back to feedPost
One business problem. Three analytical routes. One data-driven story. ☕📊
I turned raw business data into actionable decisions—not just another Power BI dashboard.
For the Onyx Data October 2026 Challenge, I worked on the Sunrise Coffee Chain analytics project, analyzing store performance, profitability, customer loyalty, revenue mix, and trading patterns across 60 UK stores (2023–2024).
🔹 My Analytical Approach
1️⃣ Python — Data Preparation
Cleaned and prepared the source datasets to establish a reliable foundation for analysis.
2️⃣ SQL — Business Analysis
Investigated store-level profitability, cost pressure, customer loyalty, revenue contribution, and trading patterns.
3️⃣ Power BI — Interactive Dashboards
Built a 3-page interactive report featuring advanced DAX measures, KPI cards, YoY comparisons, profitability analysis, and business-focused visualizations.
📊 Key Findings
• £89.7M Revenue | £16.9M Net Profit
The business recorded an aggregate net profit margin of 18.8% across the analysis period.
• Store Location Matters
Transport-Hub stores achieved a 25.1% aggregate net profit margin, compared with 18.6% for High-Street stores.
• An Area Requiring Attention
South London Corner recorded a £50.5K net loss over 24 months.
• Product Revenue Contribution
Espresso contributed 45.7% of daily revenue, while food contributed 26.1%.
• Trading Patterns
Average daily revenue was approximately 24% lower on weekends and 33% lower on UK bank holidays than on regular trading days.
💡 My Biggest Takeaway
Revenue alone does not tell the whole story. Understanding profitability, cost pressure, product contribution, and trading patterns helps businesses identify where to improve performance and make better decisions.
🔗 Explore the Complete Project
GitHub: https://github.com/SajeebTheAnalyst/sunrise-coffee-chain-analytics
If you were advising the management team, which finding would you investigate first—and why?
#DataAnalytics #SQL #PowerBI #Python #DAX #BusinessIntelligence #DataVisualization #OnyxData


I would investigate South London Corner first. Break the 24-month loss into store-month revenue, direct costs and allocated costs, then compare it with similar stores over matched trading periods. Reconcile at store-month grain before joining product or loyalty tables so a...

Thank you for the detailed insight, Simone! That's a great point about separating monthly recurring losses from one-off allocation effects. To answer your question, the loss showed consistent dips during specific operational cycles rather than a single massive spike, but...
Thanks, Mosaddek — that recurring pattern gives the next investigation a useful focus. I’d compare those cycles with the same calendar periods at similar stores, keeping contribution before allocated costs separate from reported net profit. Transaction count, average basket,...
That is an exceptionally structured framework, Simone! Comparing contribution margins before allocated costs with net profit is definitely the right diagnostic lens to separate overhead/allocation rules from actual operational inefficiencies. Tracking labor cost per trading hour...
The network for creativity
Join 1.25M professional creatives like you
Connect with clients, get discovered, and run your business 100% commission-free
Creatives on Contra have earned over $150M and we are just getting started
Challenges
View all


Related posts

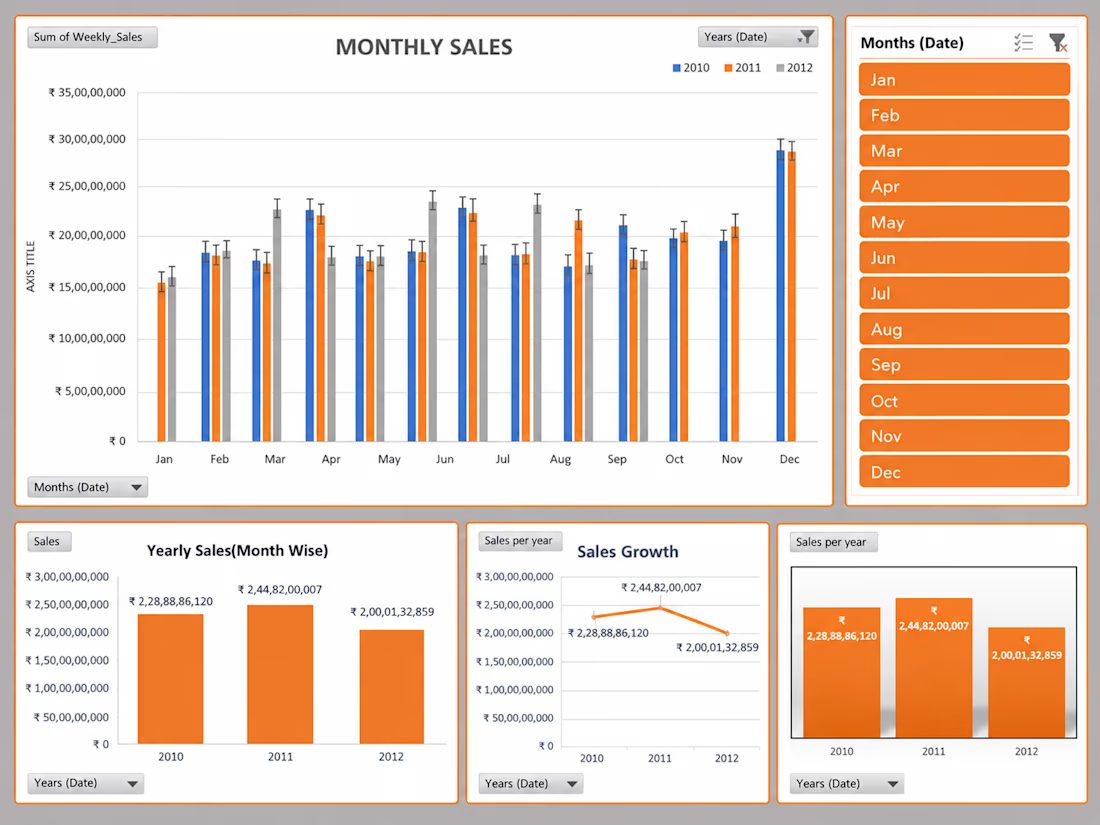
📊 Turning Data Into Insights
Sharing one of my recent Power BI dashboard projects.
I worked on transforming raw data into an interactive dashboard with a focus on:
• Data cleaning & transformation
• KPI tracking
• Interactive visualizations
• DAX calculations
• Trend & performance analysis
🛠️ Tools: Power BI • Power Query • DAX • Excel
Still learning, building, and improving with every project. 🚀
#PowerBI #DataAnalytics #DataVisualization #DAX #BusinessIntelligence #DataAnalyst #Analytics #Dashboard

Currently exploring a book design focused on making complex information easier to understand through visual language. Playing with typography, data visualization, and graphic systems to give the subject a more editorial feel.

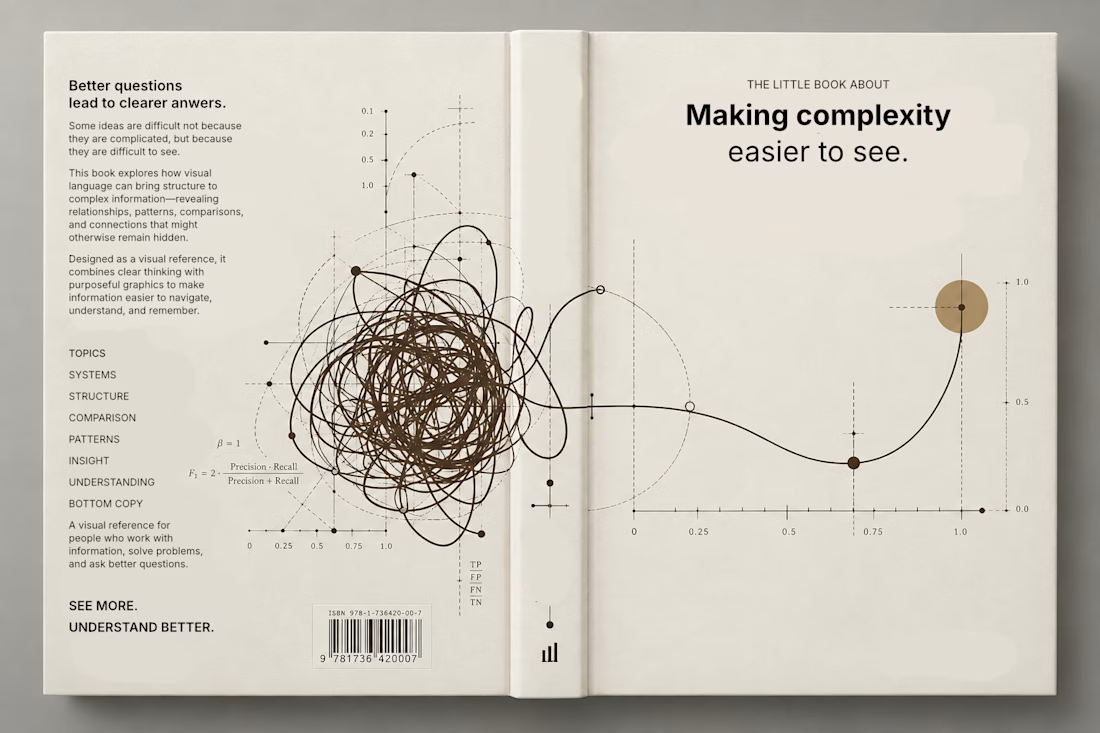

This is a trully elegant and impressive design concept.
I love it.

Case study on 100K+ real e-commerce orders (Olist dataset): why did revenue growth stop? I built a 6-page Power BI diagnostic star schema, 25+ DAX measures (revenue decomposition into volume vs. basket effects, MoM/YoY, CROSSFILTER) plus a plain-English executive report with a 30/60/90 action plan. Key findings: orders flatlined at 6.6K/month; 97% of buyers never return; one region carries 38.4% of revenue; one category hides a 15.7% decline. Full pipeline on GitHub: Python ETL, SQL validation, dashboard, report.

