The network for creativity
Join 1.25M professional creatives like you
Connect with clients, get discovered, and run your business 100% commission-free
Creatives on Contra have earned over $150M and we are just getting started
Back to feedPost

Business Analyst for a Government client on behalf of Accenture. Supported the delivery of a data warehouse programme aimed at centralising data, improving reporting capabilities and enabling data-driven decision-making across multiple departments. Worked closely with business and technical stakeholders to define data requirements and ensure alignment with strategic objectives.
My duties included the following:
▪ Led requirement gathering activities to capture data, reporting, and analytics needs through stakeholder interviews, workshops, and process analysis.
▪ Facilitated workshops with business users, data engineers and architects to define data sources, data flows and reporting requirements.
▪ Produced detailed documentation including business requirements documents (BRDs), data requirements, data mapping specifications, and user stories.
▪ Collaborated with technical teams to translate business needs into data models, ensuring clarity on data definitions, transformations, and quality rules.
▪ Translated business needs into structured user stories and acceptance criteria, supporting agile delivery and ensuring traceability from requirements through to implementation.
▪ Managed RAID logs and supported programme governance by tracking risks, dependencies, and data-related issues.
▪ Supported UAT by defining acceptance criteria, validating outputs, and ensuring delivered data aligned with business expectations.
Key outcomes included:
Key outcomes included:
▪ Delivered clearly defined data and reporting requirements, enabling the successful design and implementation of the data warehouse.
▪ Improved data consistency and trust by standardising data definitions and aligning stakeholders on a single source of truth.
▪ Strengthened delivery alignment by linking use cases and user stories directly to technical outputs, reducing ambiguity and rework.


Standardizing data definitions across departments is often the hardest part of any data warehouse programme — everyone thinks they're measuring the same thing until you put it in a room together. The fact that this project anchored everything to a single source of truth from the...
The network for creativity
Join 1.25M professional creatives like you
Connect with clients, get discovered, and run your business 100% commission-free
Creatives on Contra have earned over $150M and we are just getting started




Related posts

I’m so close to finalizing a website project!
The best feeling is heading into the weekend with the work done!
What are you working on?

Nothing beats starting the weekend with a finished project. The dashboard cards in the preview look really clean, good luck with the launch!

Inventory & Supply Chain Analytics
This project demonstrates how inventory and sales data can be transformed into actionable insights to support better stock management and supply chain decisions.
The presentation takes the analysis beyond reporting stock quantities. It focuses on understanding product movement, inventory turnover, stock availability, slow-moving products and replenishment needs.
Designed for business owners, operations managers, procurement teams and inventory controllers, the report helps answer critical operational questions:
- Which products require replenishment?
- Where is capital tied up in excess or slow-moving stock?
- Which products have high demand?
- Are inventory levels aligned with sales patterns?
The goal is to support informed purchasing decisions, improve stock availability, reduce inventory-related costs and make more efficient use of working capital.
Business value: Improved inventory control, reduced stock-related inefficiencies, better purchasing decisions and more reliable product availability.

A presentation should build toward a decision.
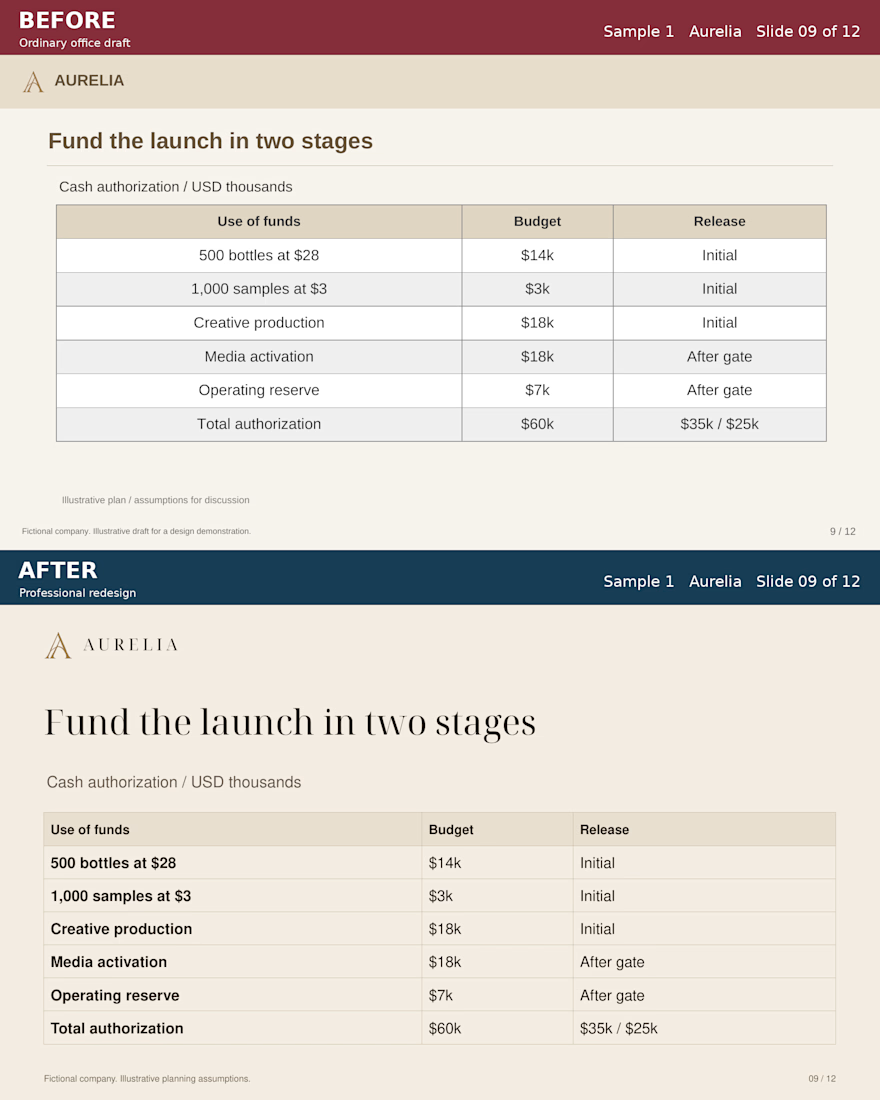
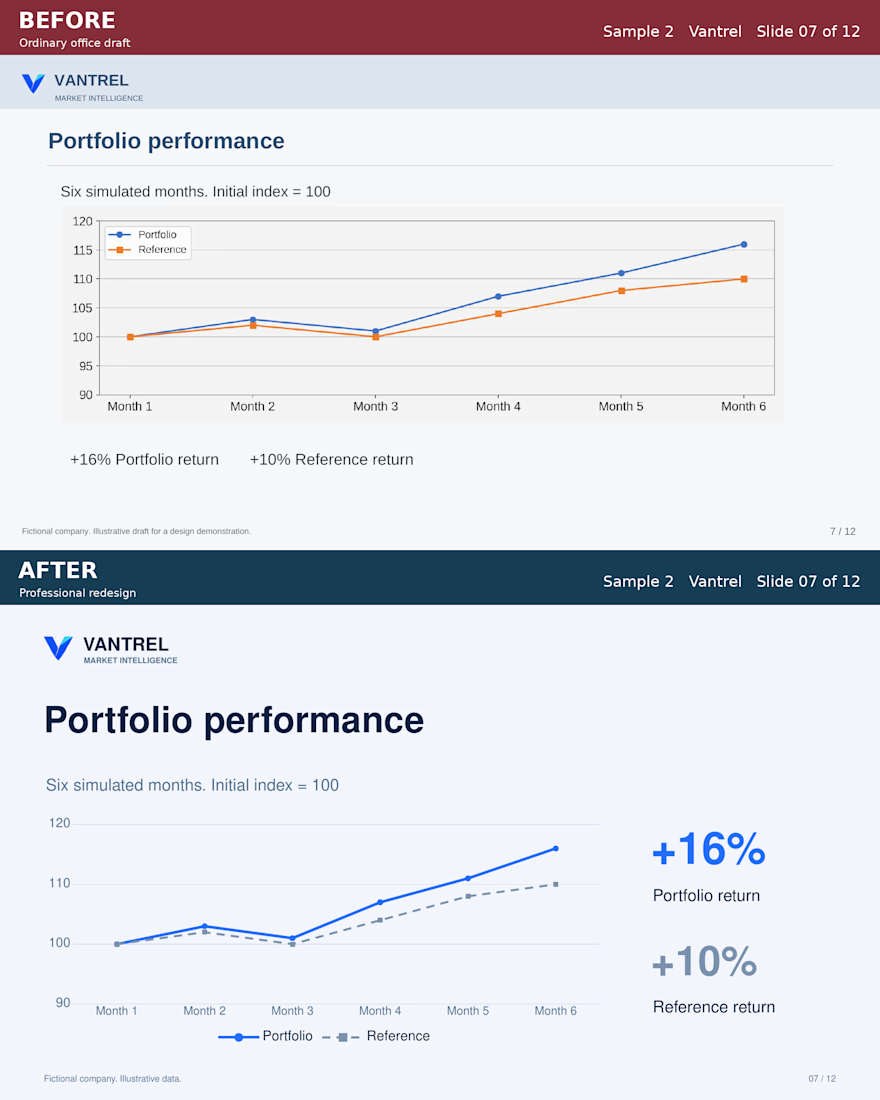
For these Aurelia and Vantrel studies, I developed two complete 12-slide business presentations. Aurelia builds toward a staged launch authorization. Vantrel builds toward a defined pilot.
Each BEFORE/AFTER pair keeps the same message and illustrative data, making the design changes easier to judge. The downloadable PowerPoint includes editable text, tables and charts.
These are self-initiated fictional projects developed with AI assistance and checked for content consistency, chart data and final rendering.
Looking at the AFTER slides, what would you simplify further to make the decision clearer?
Have a rough business deck? Send the deck, audience and deadline for a scoped redesign quote.
https://contra.com/s/v7NPev2Y-power-point-cleanup-and-presentation-redesign
Full case and downloads:
https://contra.com/p/esqL6Bvc-power-point-redesign-aurelia-and-vantrel