The network for creativity
Join 1.25M professional creatives like you
Connect with clients, get discovered, and run your business 100% commission-free
Creatives on Contra have earned over $150M and we are just getting started
Back to feedPost
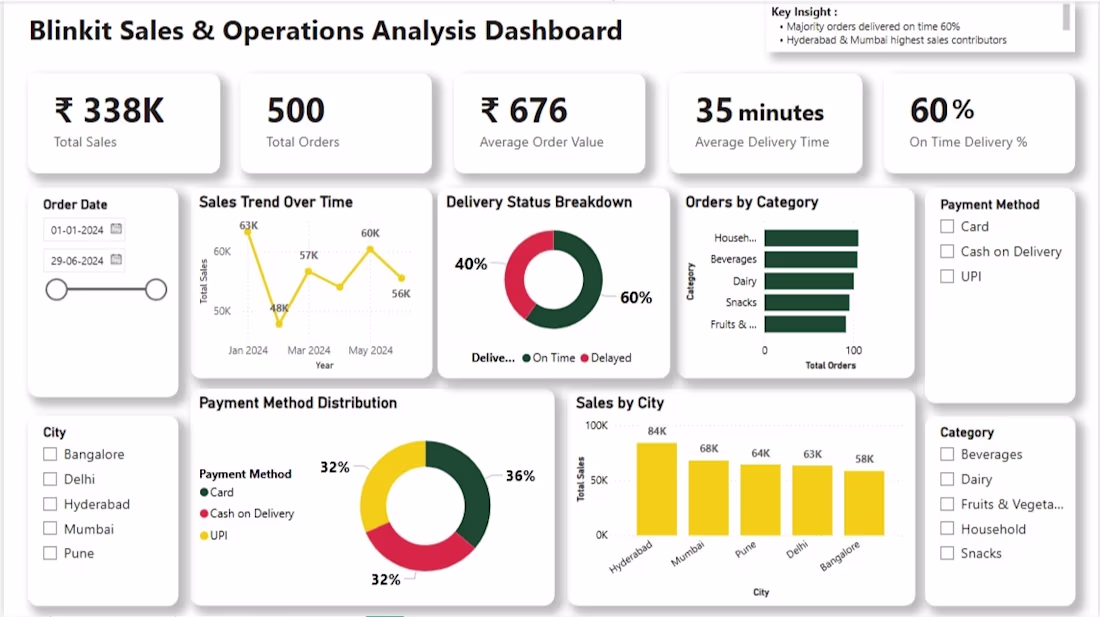
Blinkit Sales & Performance Analysis Dashboard (Power BI)
An interactive Power BI dashboard designed to analyze Blinkit's quick-commerce sales and operational efficiency.
Key Insights :
• Total Sales, Average Order Value (AOV), and Total Orders breakdown.
• Rating analysis based on item types and outlet performance.
• Comprehensive evaluation of sales distribution by outlet size and location tiers.
Developed using advanced Power BI features including data modeling, custom visuals, and interactive slicers to drive data-backed decision-making.
The network for creativity
Join 1.25M professional creatives like you
Connect with clients, get discovered, and run your business 100% commission-free
Creatives on Contra have earned over $150M and we are just getting started
Related posts
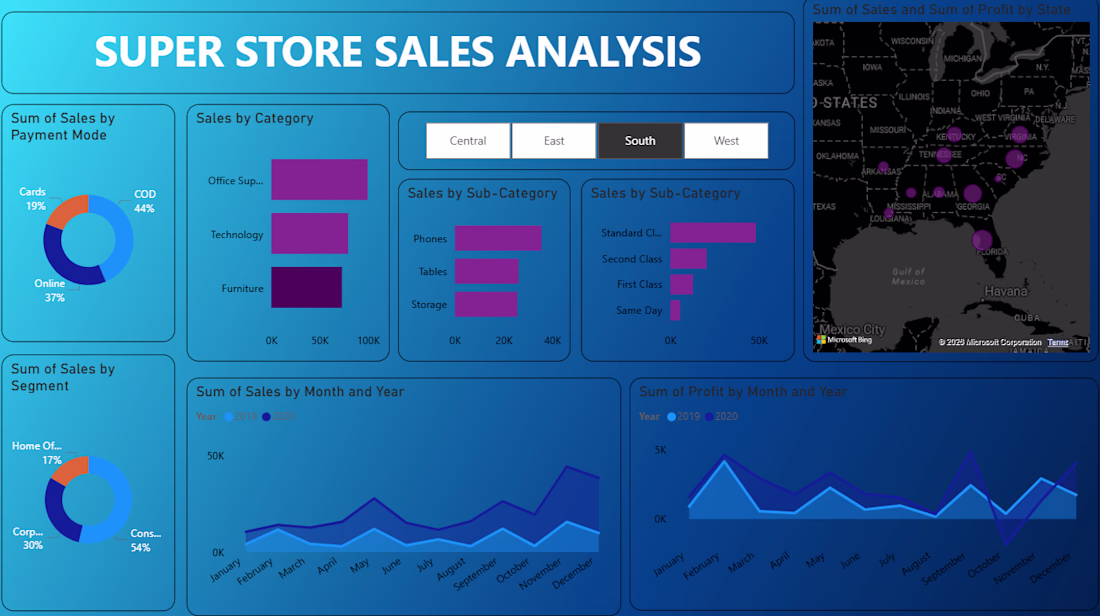
Built a comprehensive sales analytics dashboard for a retail superstore using Power BI, enabling stakeholders to monitor performance across product categories, customer segments, payment modes, and US states — with dynamic regional filters for Central, East, South, and West.
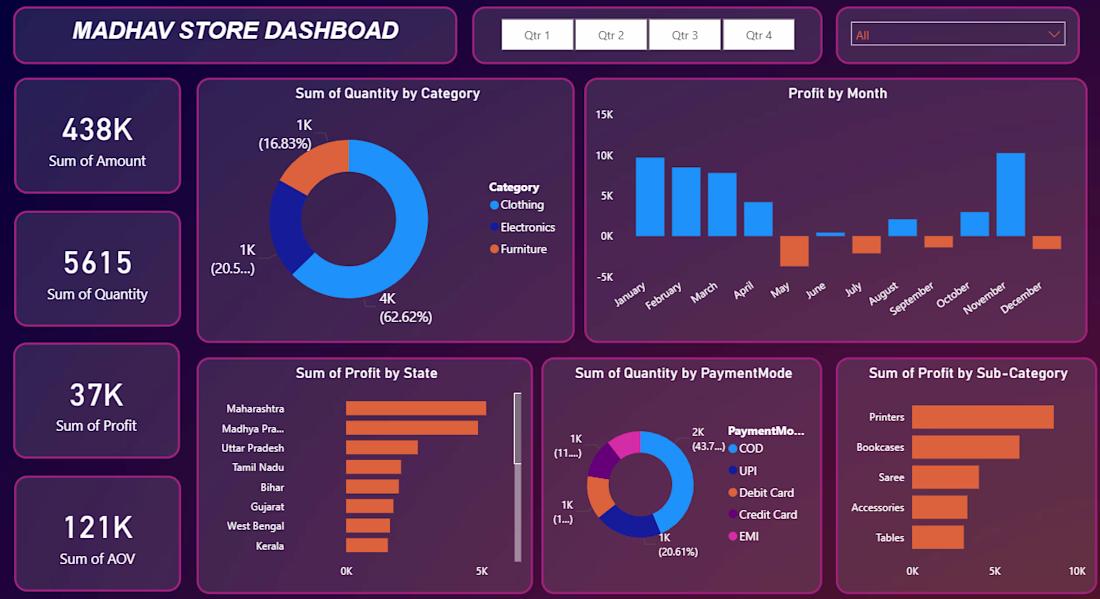
The Madhav Store Dashboard is an interactive retail analytics dashboard built to analyze sales performance, profit trends, and customer purchasing behavior. The objective of this project was to transform raw sales data into meaningful business insights that support data-driven decision-making.
This dashboard provides a clear overview of revenue, quantity sold, profit distribution, and payment preferences across different states and product categories.
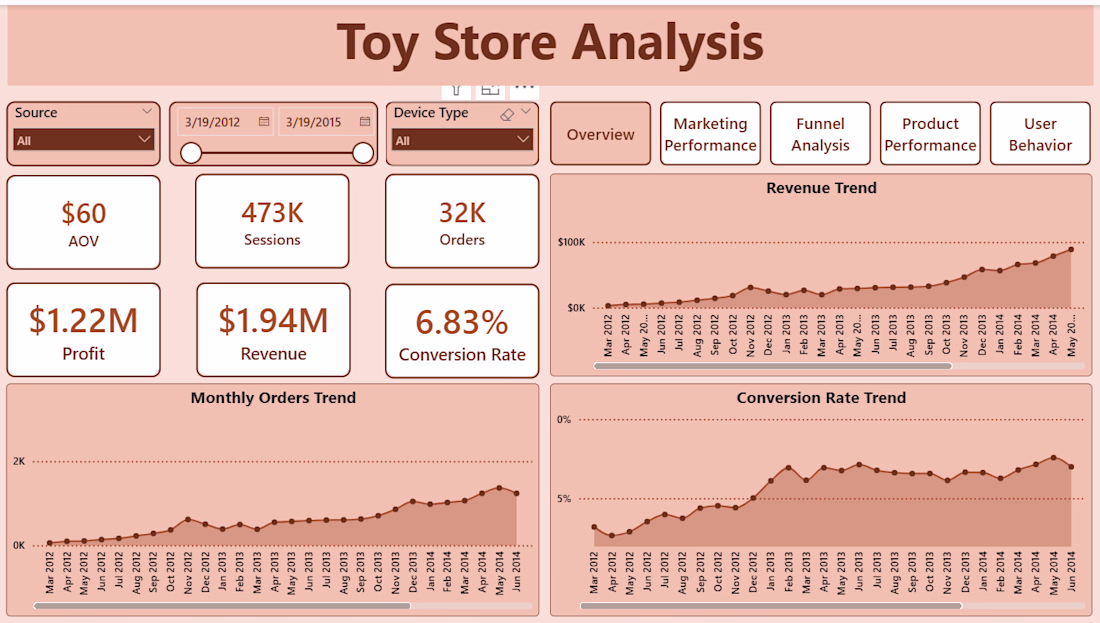
This project is a full business analysis of an e-commerce toy store using Power BI.
Instead of just showing numbers, the focus is on answering real business questions: Where are we losing customers? Which marketing channels actually drive revenue? Which products are profitable vs risky? Do repeat users behave differently from new users?
Trending
Claude
Claude has entered the design space. How are you using Claude Design?
Contra University
Learn from expert creatives how to earn more using next-gen AI tools.
creativeaiflow
Creative AI workflows are evolving. What tools do you use, and what are their strengths and weaknesses?
portfolioreview
The best portfolios tell a story, not just show a grid. Share yours for feedback.
freelancerlife
Freelancer life is wins, pivots, and everything in between. What’s yours right now?