
Yashika Likhitker
I turn raw data and pixels into stories that drive action
Ready for work
Yashika is ready for their next project!
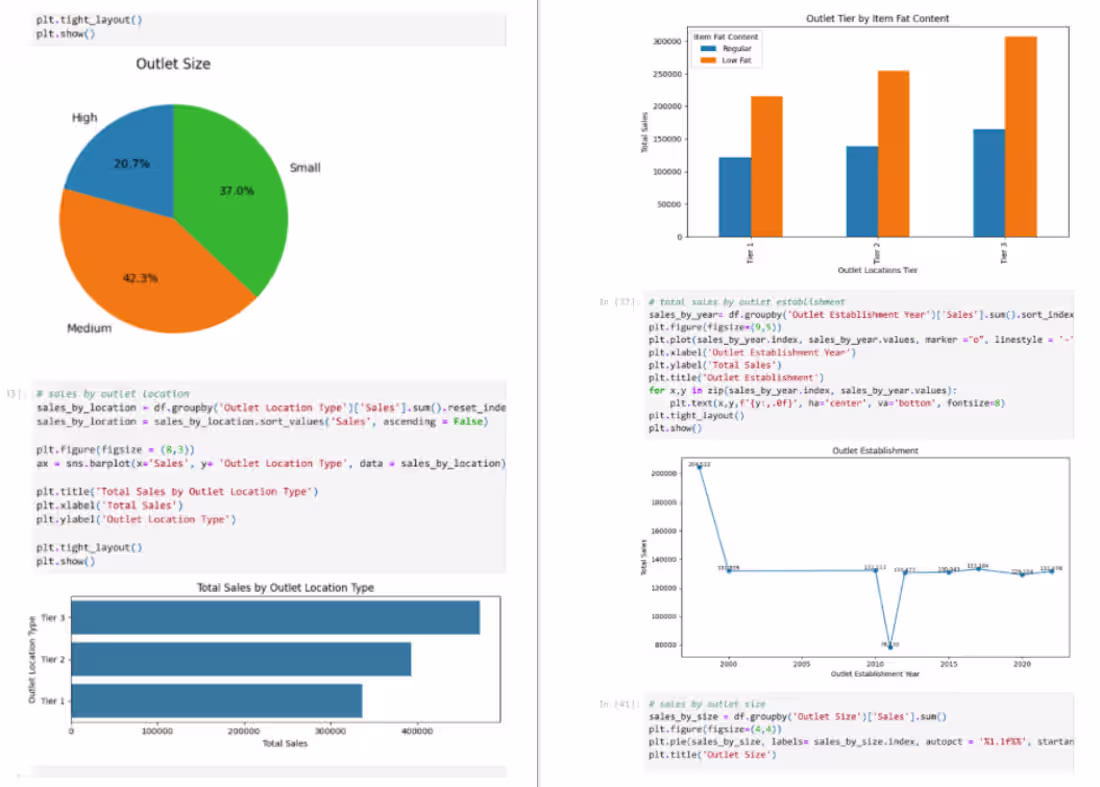
The Blinkit sales analysis reveals that medium-sized outlets contribute the highest share of revenue (42.3%), followed by small outlets (37%), while large outlets contribute the least, indicating that bigger size does not always mean better performance. Tier 3 cities generate the highest overall sales, outperforming Tier 1 and Tier 2 locations, suggesting stronger demand in developing markets. Sales from older outlets are significantly higher, reflecting customer loyalty and brand establishment over time. Additionally, low-fat products consistently outperform regular items across all tiers, highlighting a growing customer preference for healthier options and guiding future expansion, marketing, and inventory strategies.
1
9
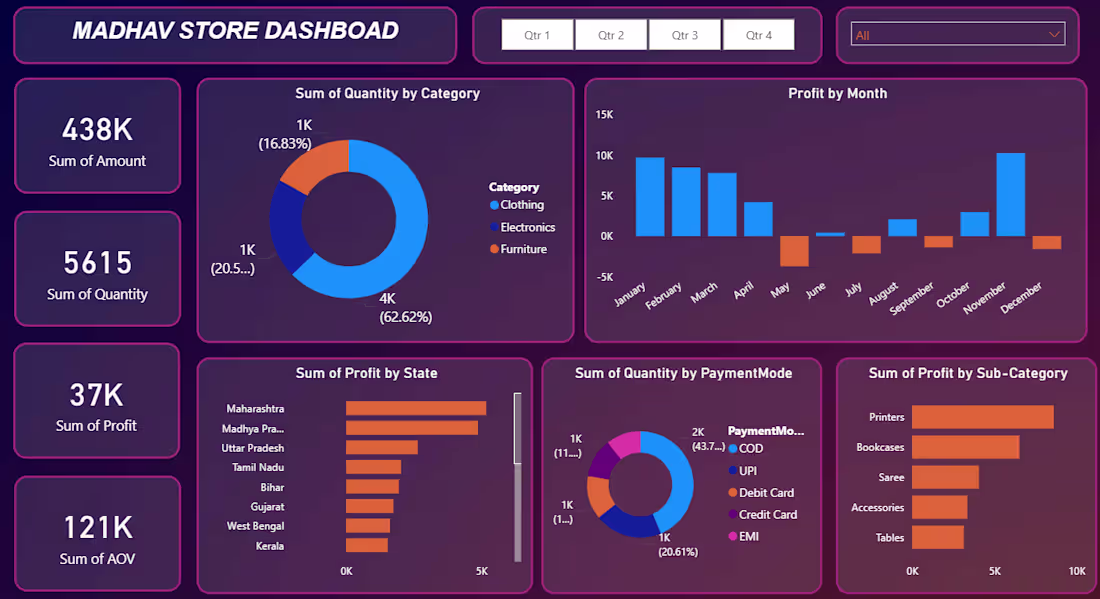
The Madhav Store Dashboard is an interactive retail analytics dashboard built to analyze sales performance, profit trends, and customer purchasing behavior. The objective of this project was to transform raw sales data into meaningful business insights that support data-driven decision-making.
This dashboard provides a clear overview of revenue, quantity sold, profit distribution, and payment preferences across different states and product categories.
1
15
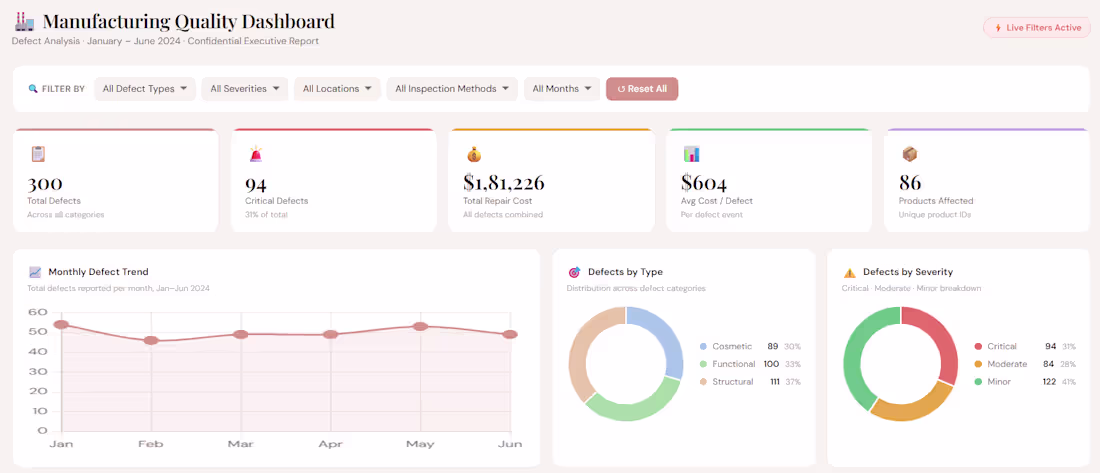
Built a single-page executive dashboard to analyze 1,000+ manufacturing defect records across a 6-month production cycle. Every visual re-renders in real time as filters change.
Designed with a clean pastel aesthetic for C-suite readability — flat layout, meaningful color encoding (Critical = red, Moderate = amber, Minor = green), and zero-clutter presentation. Stack: HTML · CSS · JavaScript · Chart.js
1
20
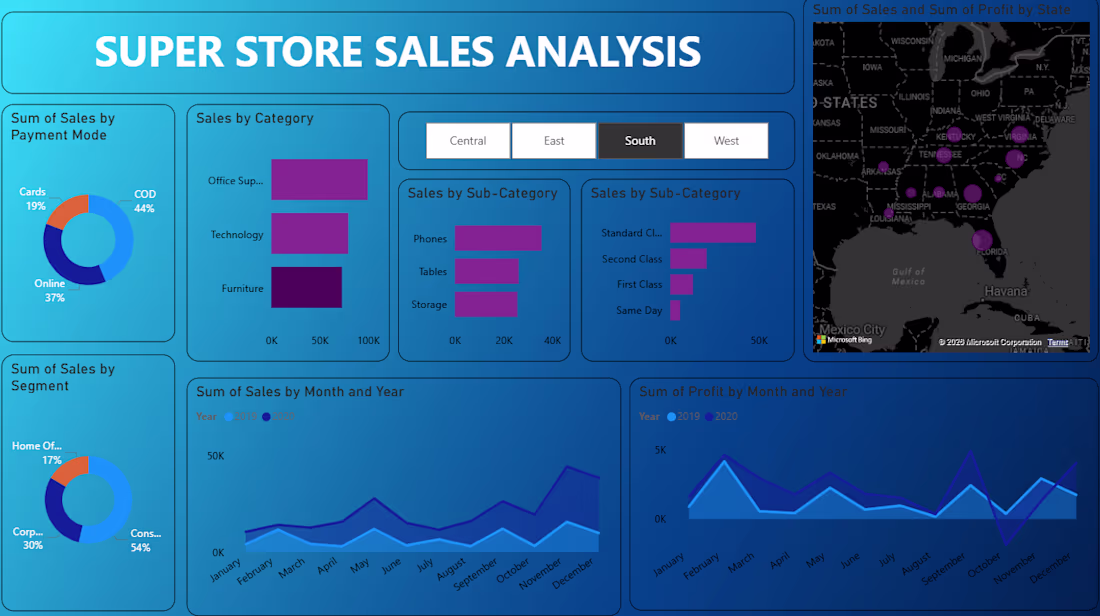
Built a comprehensive sales analytics dashboard for a retail superstore using Power BI, enabling stakeholders to monitor performance across product categories, customer segments, payment modes, and US states — with dynamic regional filters for Central, East, South, and West.
1
24