
Sapna Vikram
Data Analyst transforming raw data into business insights.
New to Contra
Sapna is building their profile!
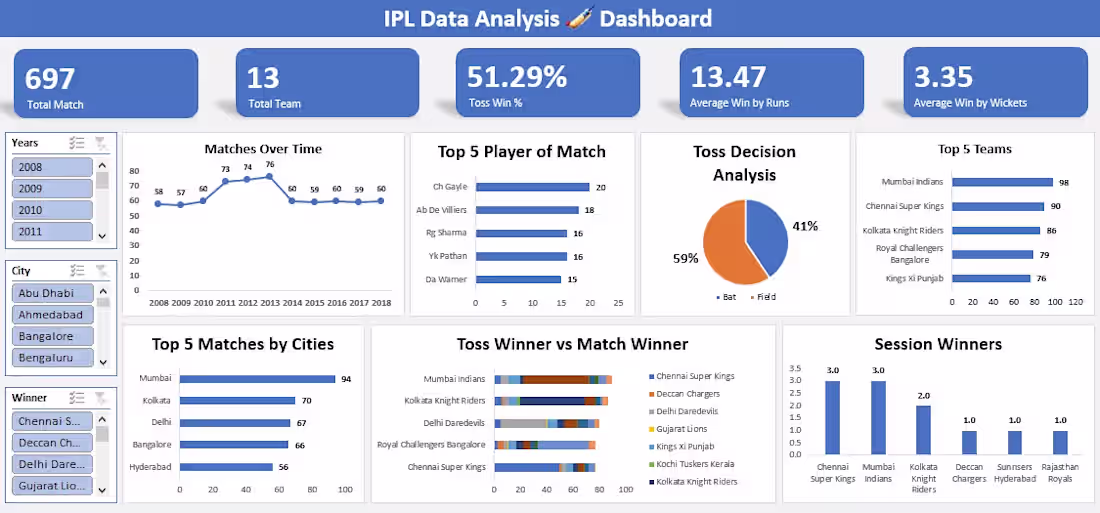
IPL Sports Data Analytics & Performance Dashboard (Excel)
An interactive sports analytics dashboard designed in Microsoft Excel to analyze Indian Premier League (IPL) match data and historical trends.
Key Insights :
Total matches played over time and season-wise performance trends.
Detailed analysis of toss decisions (Bat vs. Field) and their impact on match outcomes.
Top-performing teams, stadiums with highest match counts, and historical victory metrics.
Built using dynamic Pivot Tables, advanced formulas, custom charts, and interactive slicers for seamless data exploration.
2
2
83
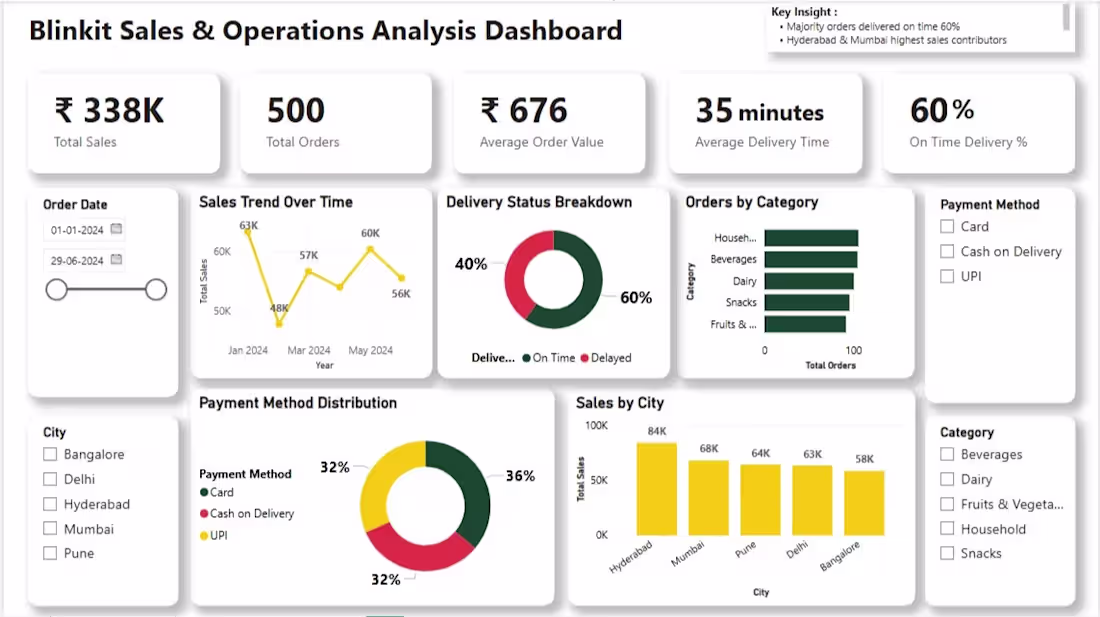
Blinkit Sales & Performance Analysis Dashboard (Power BI)
An interactive Power BI dashboard designed to analyze Blinkit's quick-commerce sales and operational efficiency.
Key Insights :
• Total Sales, Average Order Value (AOV), and Total Orders breakdown.
• Rating analysis based on item types and outlet performance.
• Comprehensive evaluation of sales distribution by outlet size and location tiers.
Developed using advanced Power BI features including data modeling, custom visuals, and interactive slicers to drive data-backed decision-making.
1
54
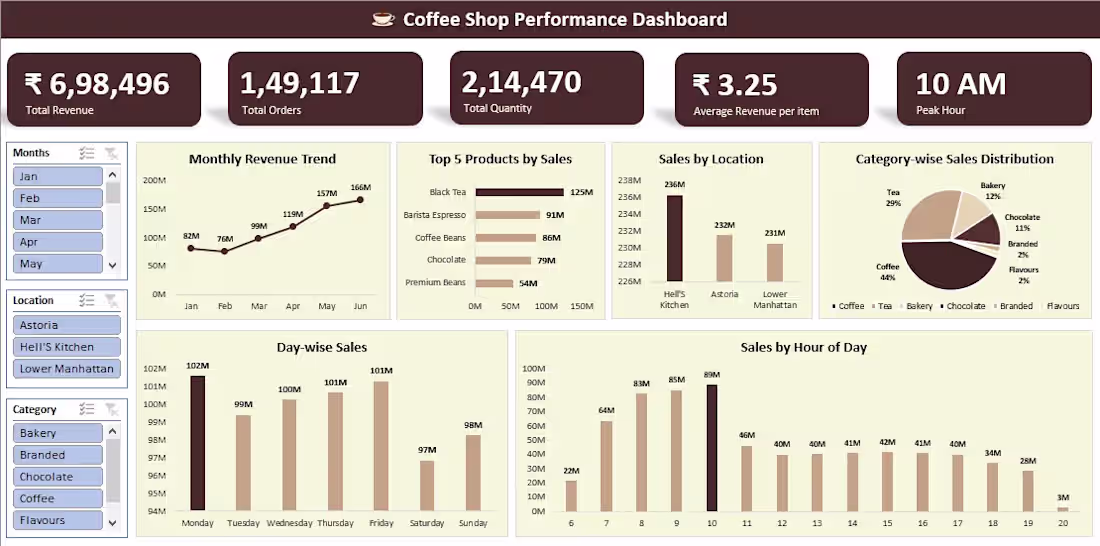
Coffee Shop Performance Dashboard
Created an interactive business intelligence dashboard in Excel to analyze coffee shop operations. Tracked over 149K orders to uncover key insights, including peak sales hours, top revenue-generating items, and location-wise sales metrics.
2
2
75
Excited to share my latest E-commerce Sales Performance Dashboard created in Excel! Used Pivot Tables, advanced charts, and slicers to deliver actionable business insights. Check it out on my portfolio! 📊🚀
2
69