The network for creativity
Join 1.25M professional creatives like you
Connect with clients, get discovered, and run your business 100% commission-free
Creatives on Contra have earned over $150M and we are just getting started
Back to feedPost

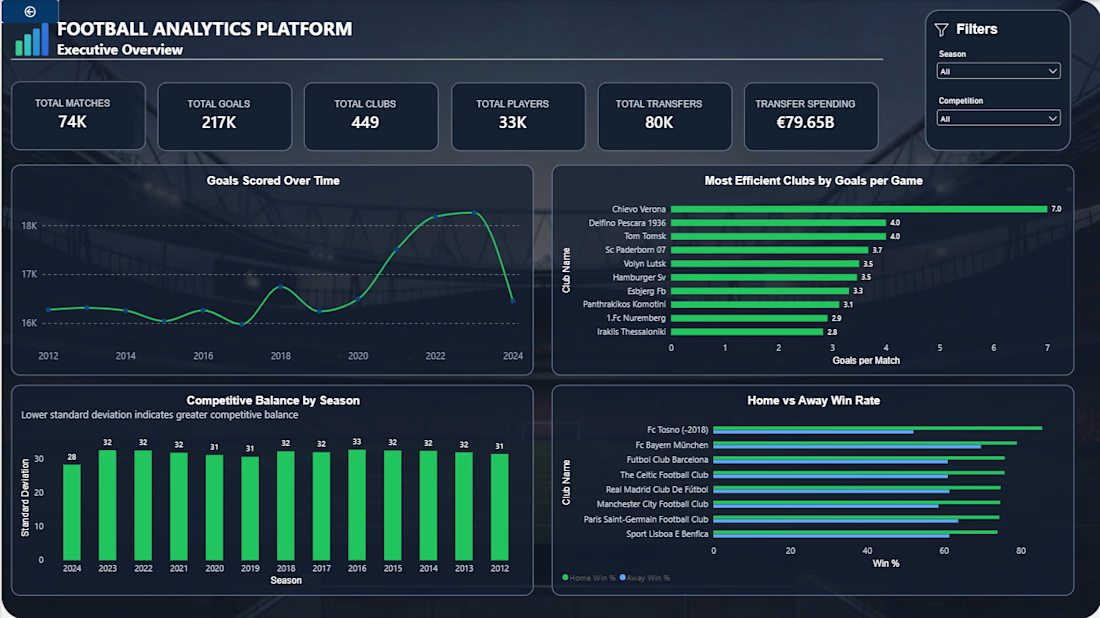
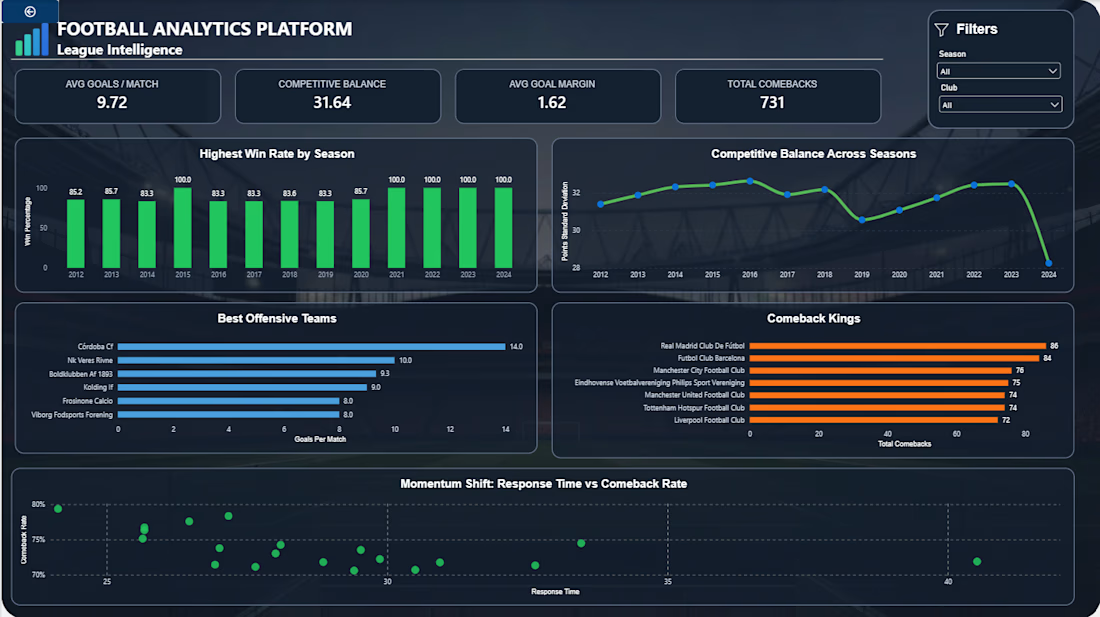
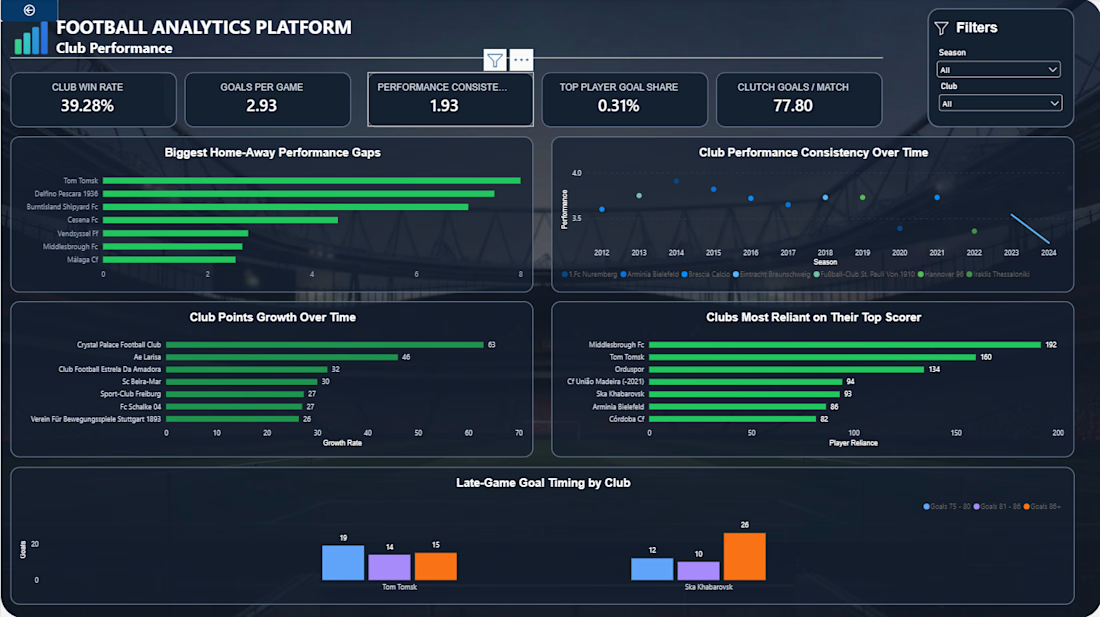
Built an end-to-end football analytics project using 1.7M+ records covering matches, players, clubs, competitions, appearances, transfers, and valuations.
I cleaned and explored the data with Python, performed analytical work using SQL and SQLite, and developed an interactive Power BI dashboard covering club performance, league intelligence, match analysis, player performance, and the transfer market.
The project was designed around realistic questions a sporting or performance department might need to answer, with the focus on turning a large dataset into clear, decision-ready insights.


The network for creativity
Join 1.25M professional creatives like you
Connect with clients, get discovered, and run your business 100% commission-free
Creatives on Contra have earned over $150M and we are just getting started









Related posts

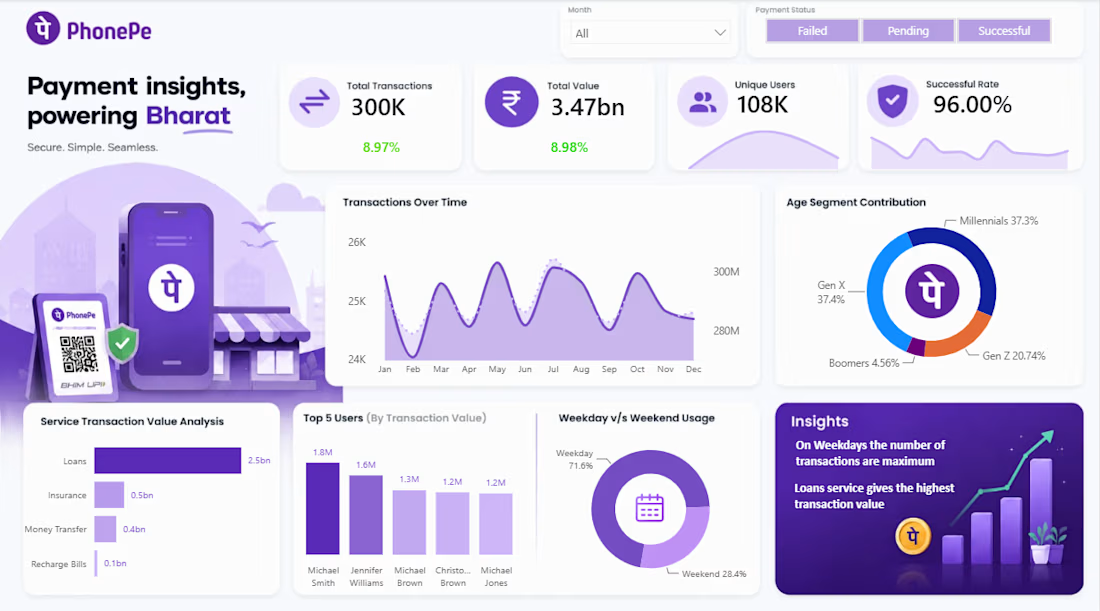
PhonePe Transaction Analysis Dashboard | Power BI
Developed an interactive Power BI dashboard to analyze PhonePe transaction data and present key business insights through data visualization. The dashboard highlights important performance indicators, transaction success rates, and transaction trends to support data-driven decision-making.
Tools Used: Power BI, Data Visualization, Data Analysis
Key Highlights:
Visualized transaction performance using interactive charts and KPIs.
Analyzed transaction success rates to understand payment performance.
Designed a clean, interactive dashboard for easy interpretation of data.
Used slicers to support dynamic filtering and exploration.
Project Objective: Transform transaction data into clear, actionable insights through an interactive dashboard.😍



Generative image and video models don't keep a face: the same woman drifts from one shot to the next, and garments lose the details that make them recognisable. on-model-pipeline generates fashion stills and clips with a fixed cast.


Financial & Explanatory Motion Design: The Story of Inflation
Video Editing * Motion Graphics * DaVinci Resolve * Visual Effects
A dynamic motion graphics and explanatory video exploring global and Indian economic trends. This project features custom-paced text animation, newspaper cutout aesthetics, animated statistical charts, and seamless integration of real-world footage. Edited and styled to maximize audience engagement and retention through sophisticated visual storytelling.


The paced typography makes the inflation story easier to follow.