The network for creativity
Join 1.25M professional creatives like you
Connect with clients, get discovered, and run your business 100% commission-free
Creatives on Contra have earned over $150M and we are just getting started
Back to feedPost
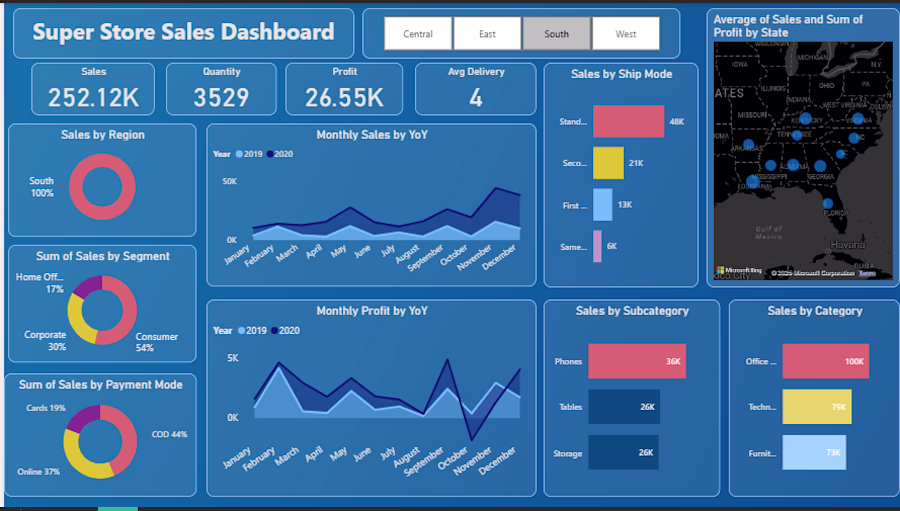
Superstore Sales Dashboard & Forecasting🙌
• Developed interactive dashboard analyzing 10,000+ transactions to track revenue and profit metrics.
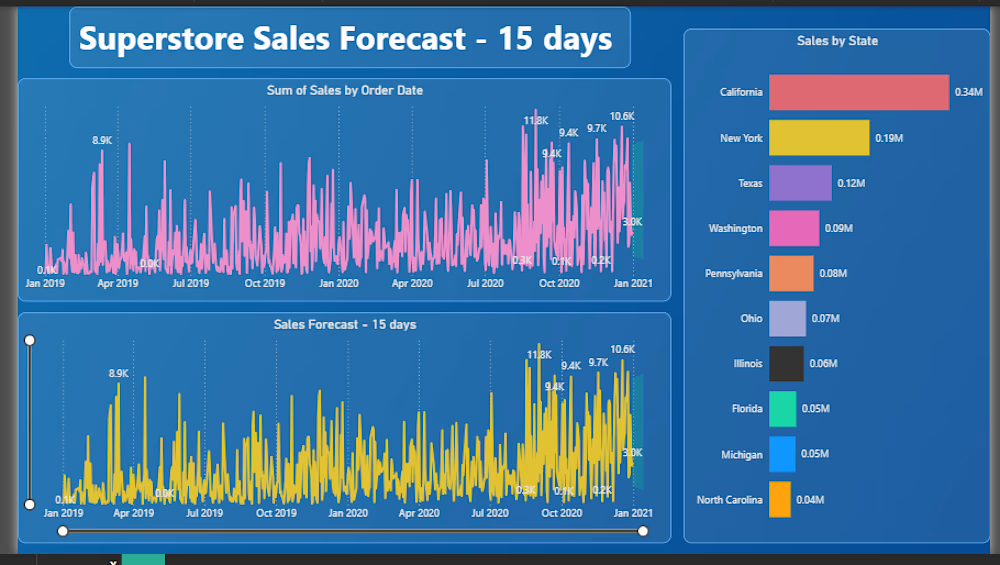
• Performed trend analysis and 15-day forecasting, reducing manual reporting effort by 40%.
• Provided insights to improve inventory planning and sales monitoring.
Looks great
Thank you.
Adding a 15-day forecast alongside the sales dashboard is a smart move — most dashboards only show what happened, not what's coming. The YoY monthly comparison view gives really clear context too. Did you build the forecasting model using Power BI's built-in analytics or a custom formula approach?
“Thank you for the feedback! I used Power BI’s built-in forecasting from the Analytics pane for the 15-day prediction. While it provides quick insights using time-series techniques, I’m also exploring custom approaches for more control over assumptions.”
The network for creativity
Join 1.25M professional creatives like you
Connect with clients, get discovered, and run your business 100% commission-free
Creatives on Contra have earned over $150M and we are just getting started
Related posts
Financial Trend Analysis & Customer Churn Dashboard
Every metric has a purpose. Designed this dashboard for VelocityAI to make workflow monitoring simple and fast⚡
Here's a preview :)
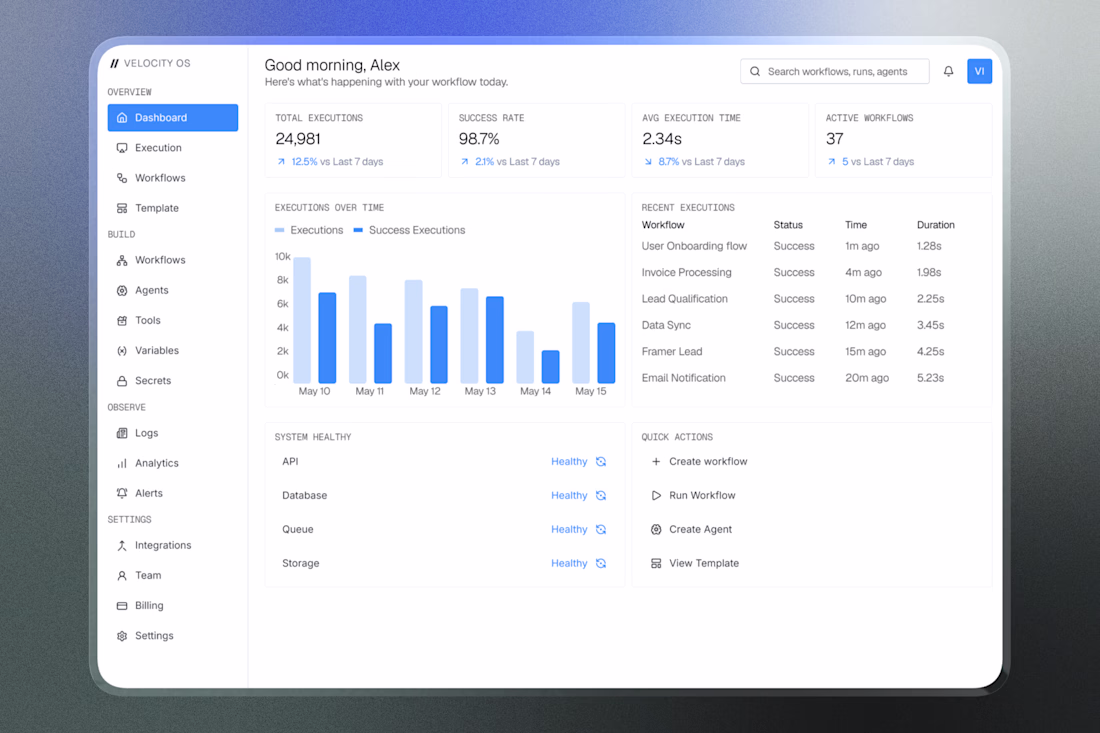
Great visualization! Which library or tool did you use to create this?
Trending
Claude
Claude has entered the design space. How are you using Claude Design?
Contra University
Learn from expert creatives how to earn more using next-gen AI tools.
creativeaiflow
Creative AI workflows are evolving. What tools do you use, and what are their strengths and weaknesses?
freelancerlife
Freelancer life is wins, pivots, and everything in between. What’s yours right now?