The network for creativity
Join 1.25M professional creatives like you
Connect with clients, get discovered, and run your business 100% commission-free
Creatives on Contra have earned over $150M and we are just getting started
Back to feedPost

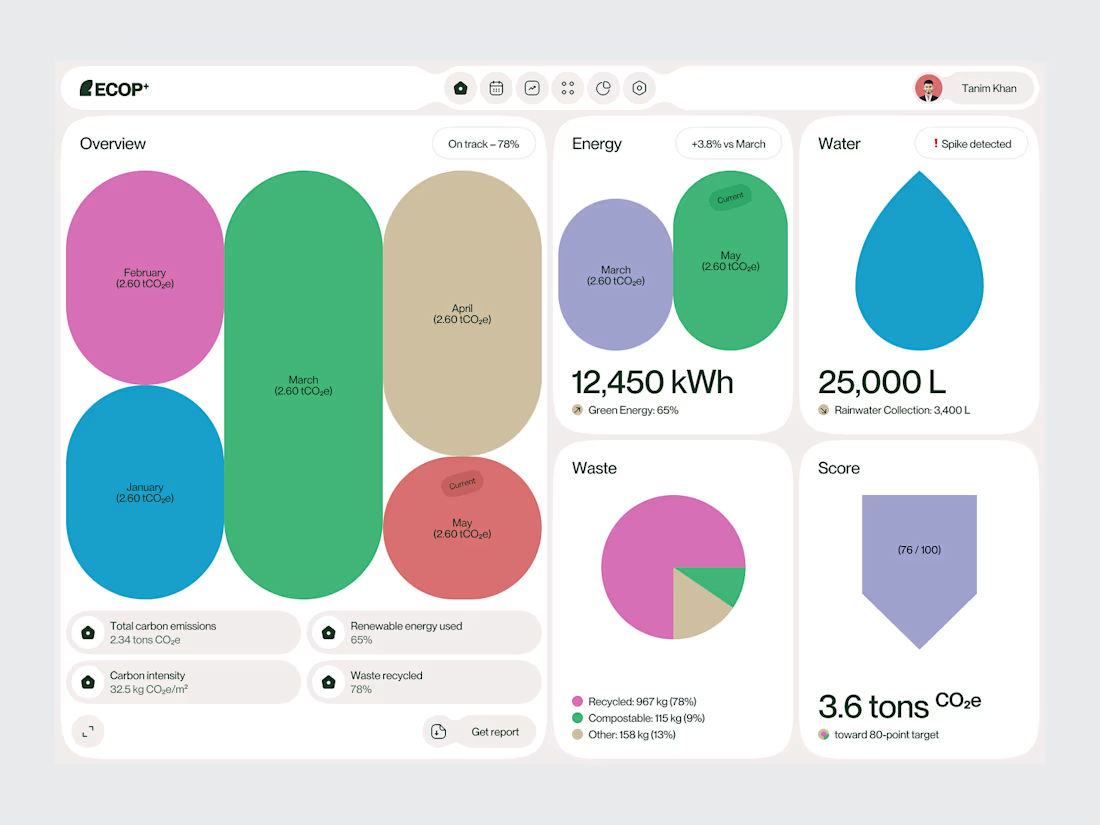
Sustainable Emission Tracker Dashboard
Sustainability platforms often bring together a large amount of environmental data.
The challenge is turning that information into something people can understand quickly.
For this Sustainable Emission Tracker Dashboard, we designed the experience around emissions performance, sustainability targets and progress tracking.
The interface uses clear metric cards, structured charts and visual indicators to create a more understandable view of environmental performance.
Rather than treating every data point equally, the dashboard creates hierarchy around the information users are most likely to monitor and act on.
Focus: Carbon Emissions Tracking · Sustainability Dashboard · ESG UI/UX · Data Visualization · Climate-Tech Product Design
The goal was to make complex environmental data feel structured, readable and useful.
Designed by WaxyWeb.
Building a sustainability or climate-tech product?


Love it 🤩

Excellent job!
The network for creativity
Join 1.25M professional creatives like you
Connect with clients, get discovered, and run your business 100% commission-free
Creatives on Contra have earned over $150M and we are just getting started







Related posts

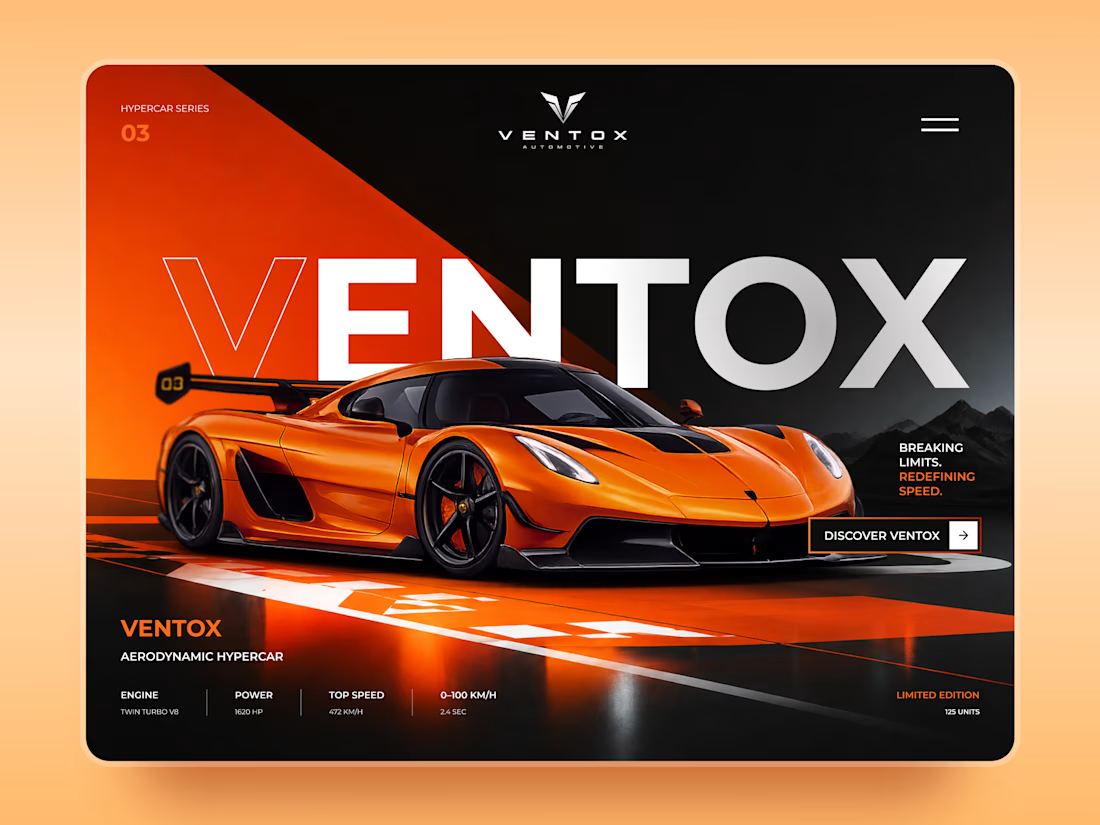
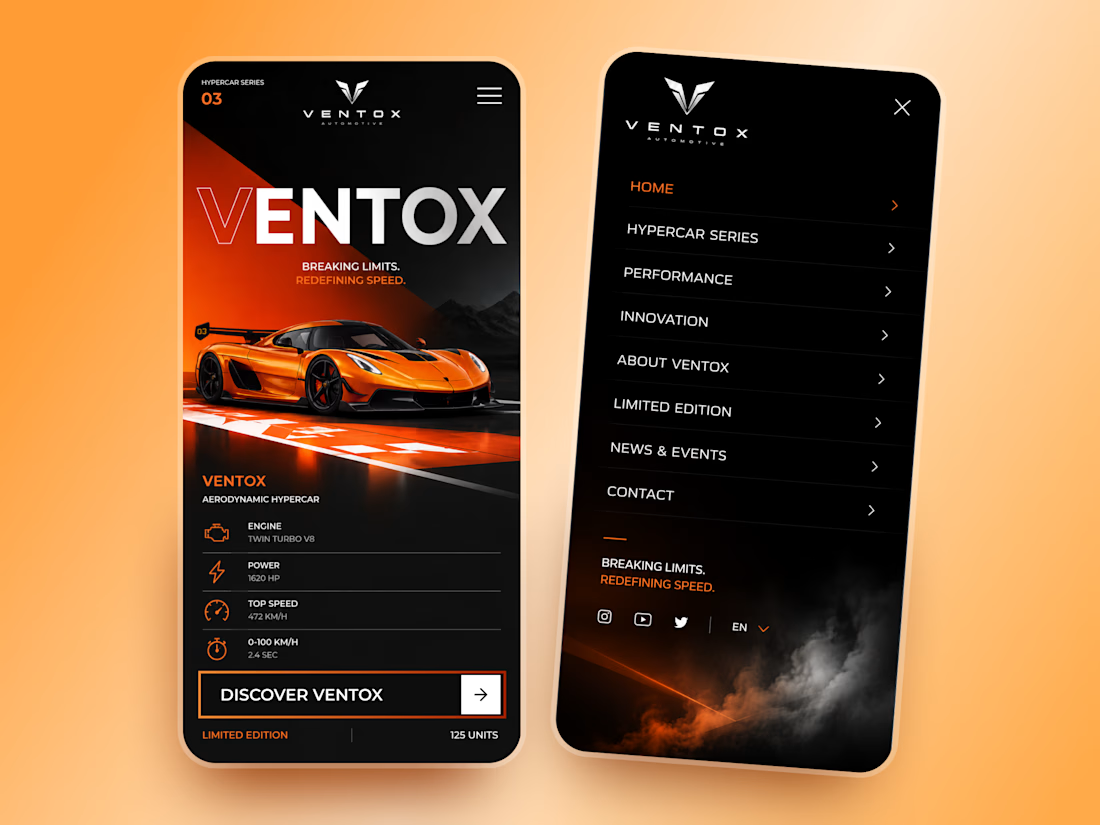
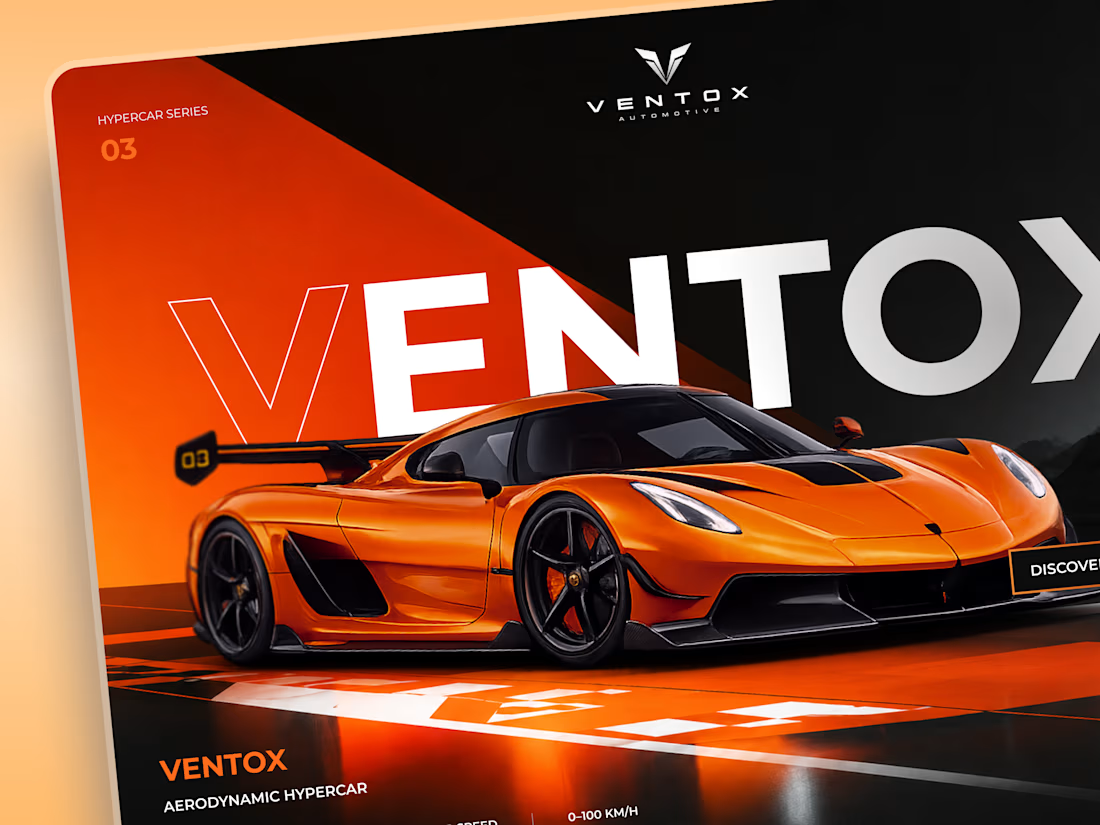
Ventox — Hypercar Landing Page 🏎️🔥
Ventox is a high-performance automotive landing page concept built around speed, exclusivity, and bold visual storytelling.
The design combines a striking orange hypercar, oversized typography, and a dramatic black-and-orange palette to create an immersive digital experience.
Special attention was given to:
A cinematic hero composition that puts the hypercar in the spotlight.
Oversized typography that reinforces the brand's identity.
Sharp geometric shapes and high-contrast colors inspired by speed.
Performance specifications presented in a clean, structured layout.
A prominent CTA that directs attention to the vehicle.
Responsive mobile layouts with simplified content and intuitive navigation.
The result is a bold automotive experience that brings together premium aesthetics, performance-focused storytelling, and clear navigation.
Looking to create a distinctive website for your automotive or luxury brand? Let's build something extraordinary. ⚡



So, what is ROSI?
A few cans.
Five colours.
One very simple fish.
A ridiculously large wordmark.
And hopefully proof that everyday products don’t have to look everyday.
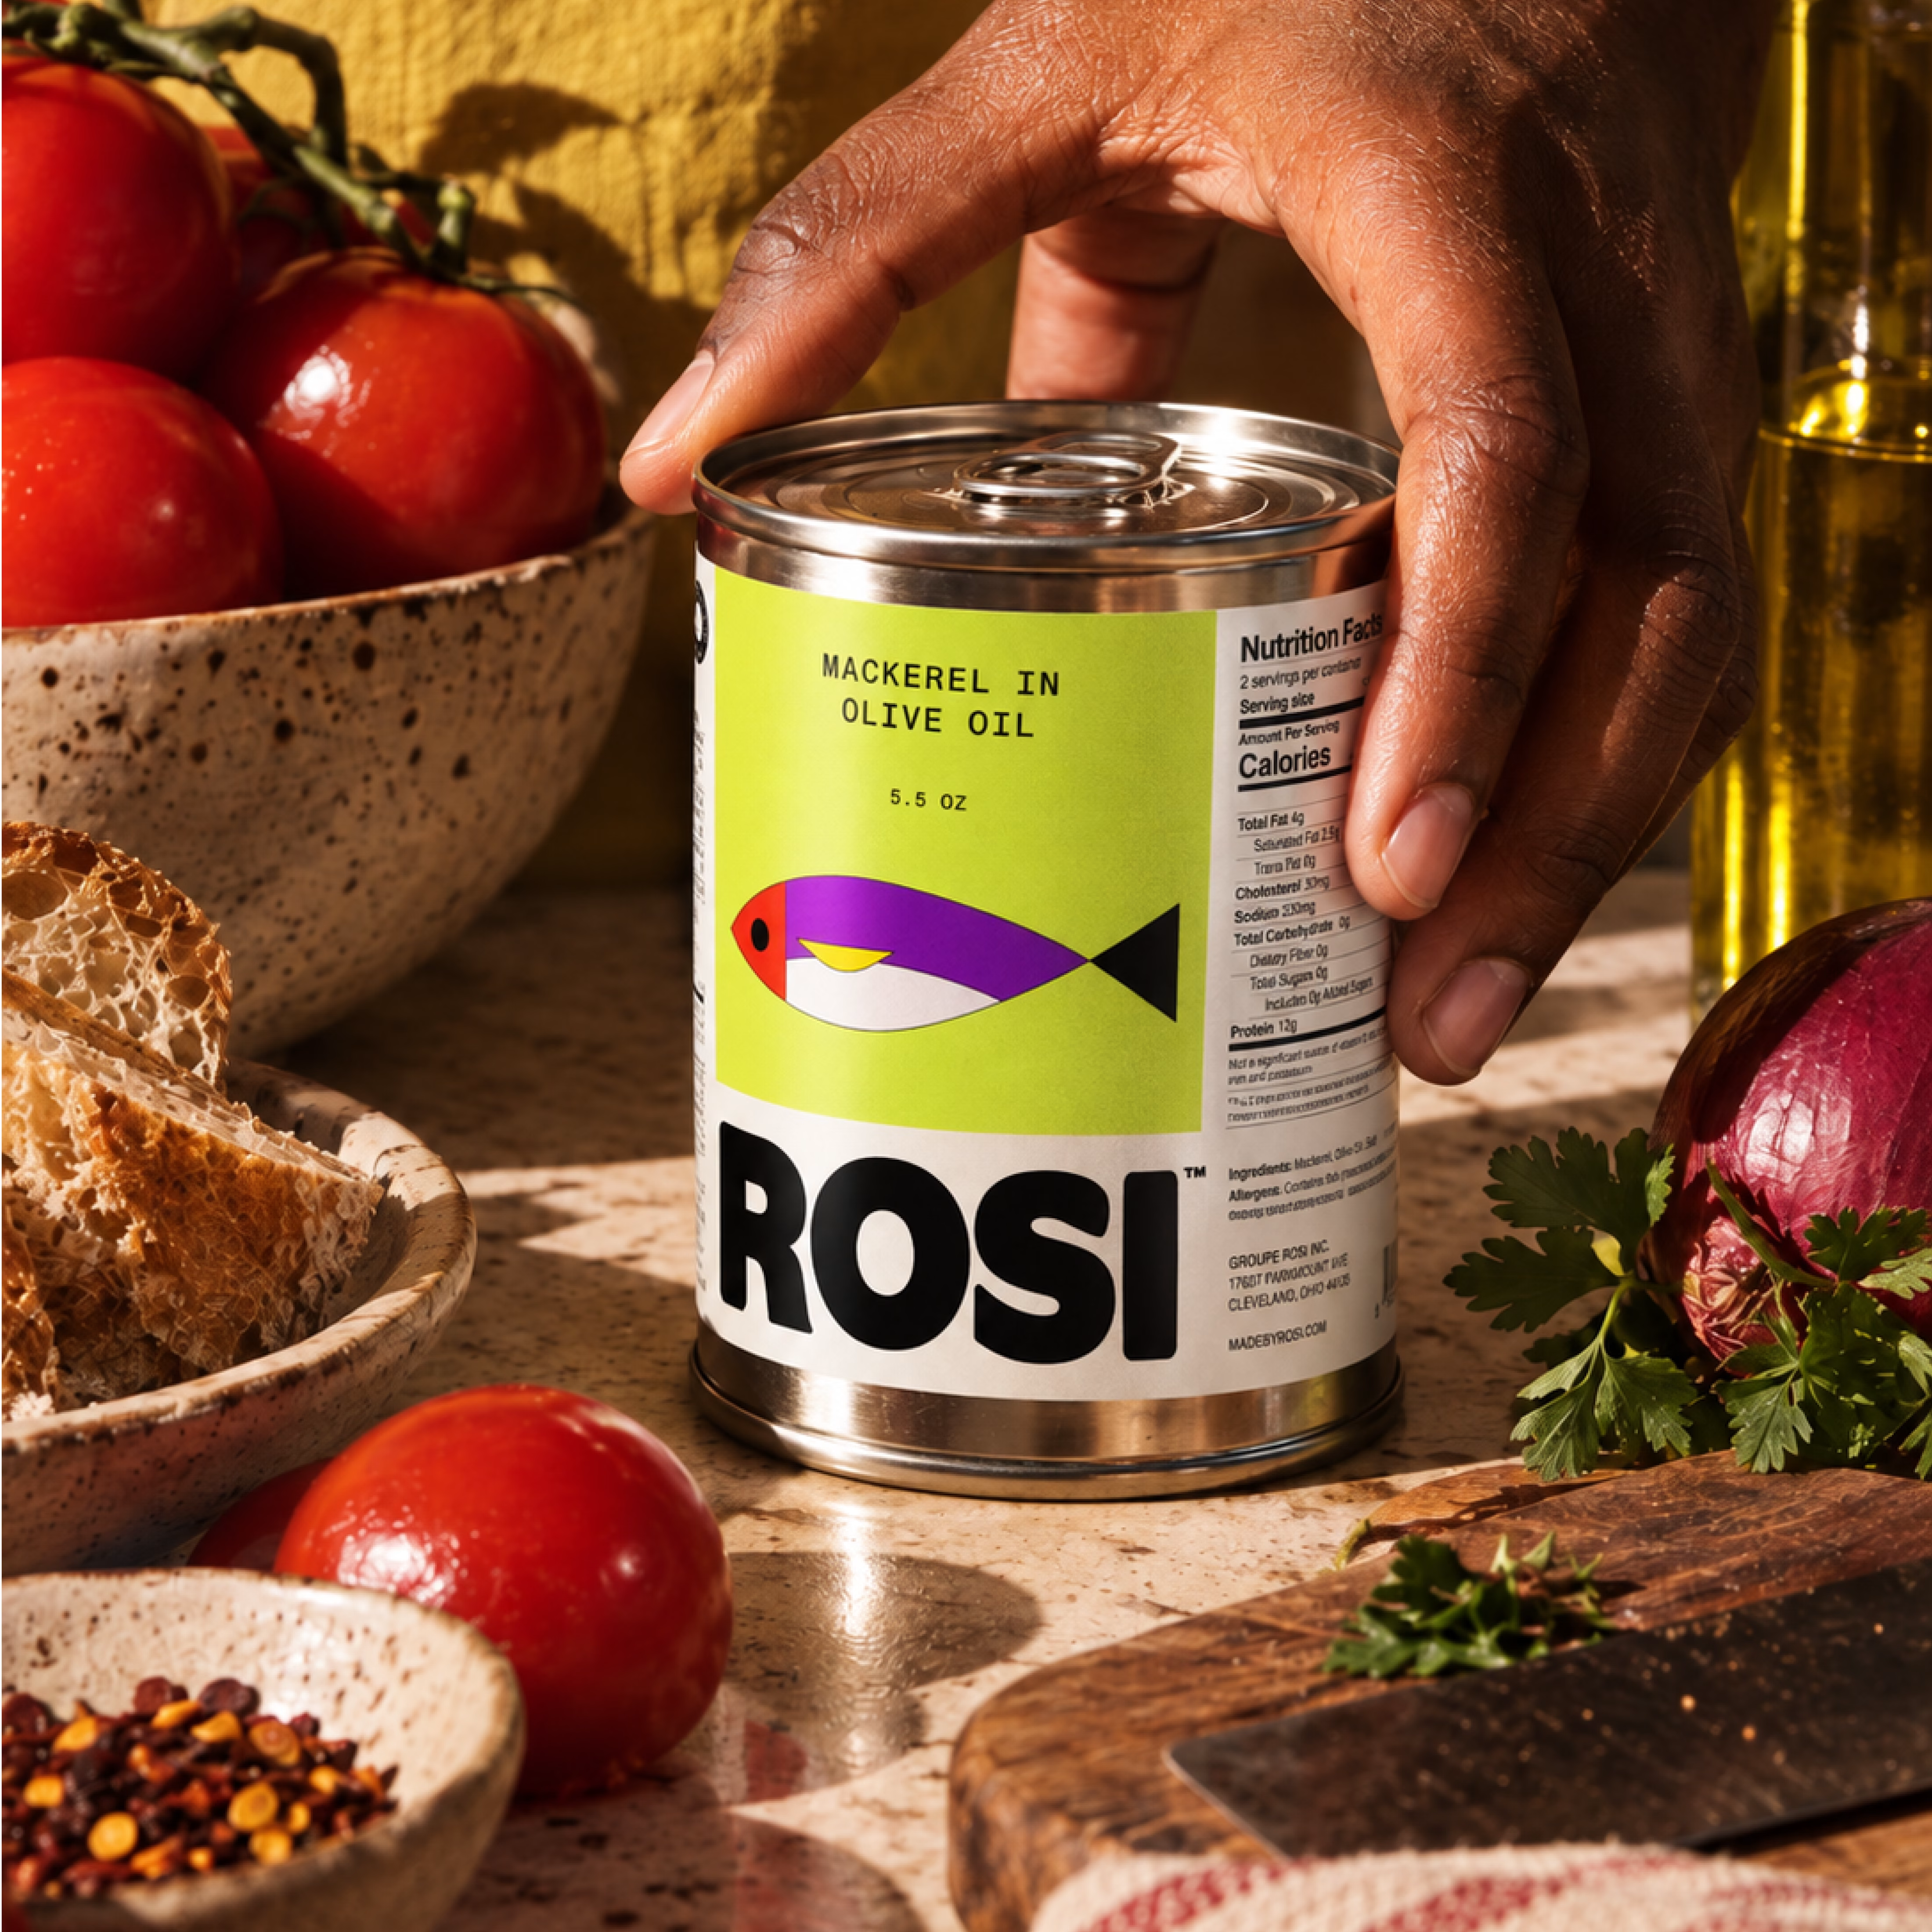
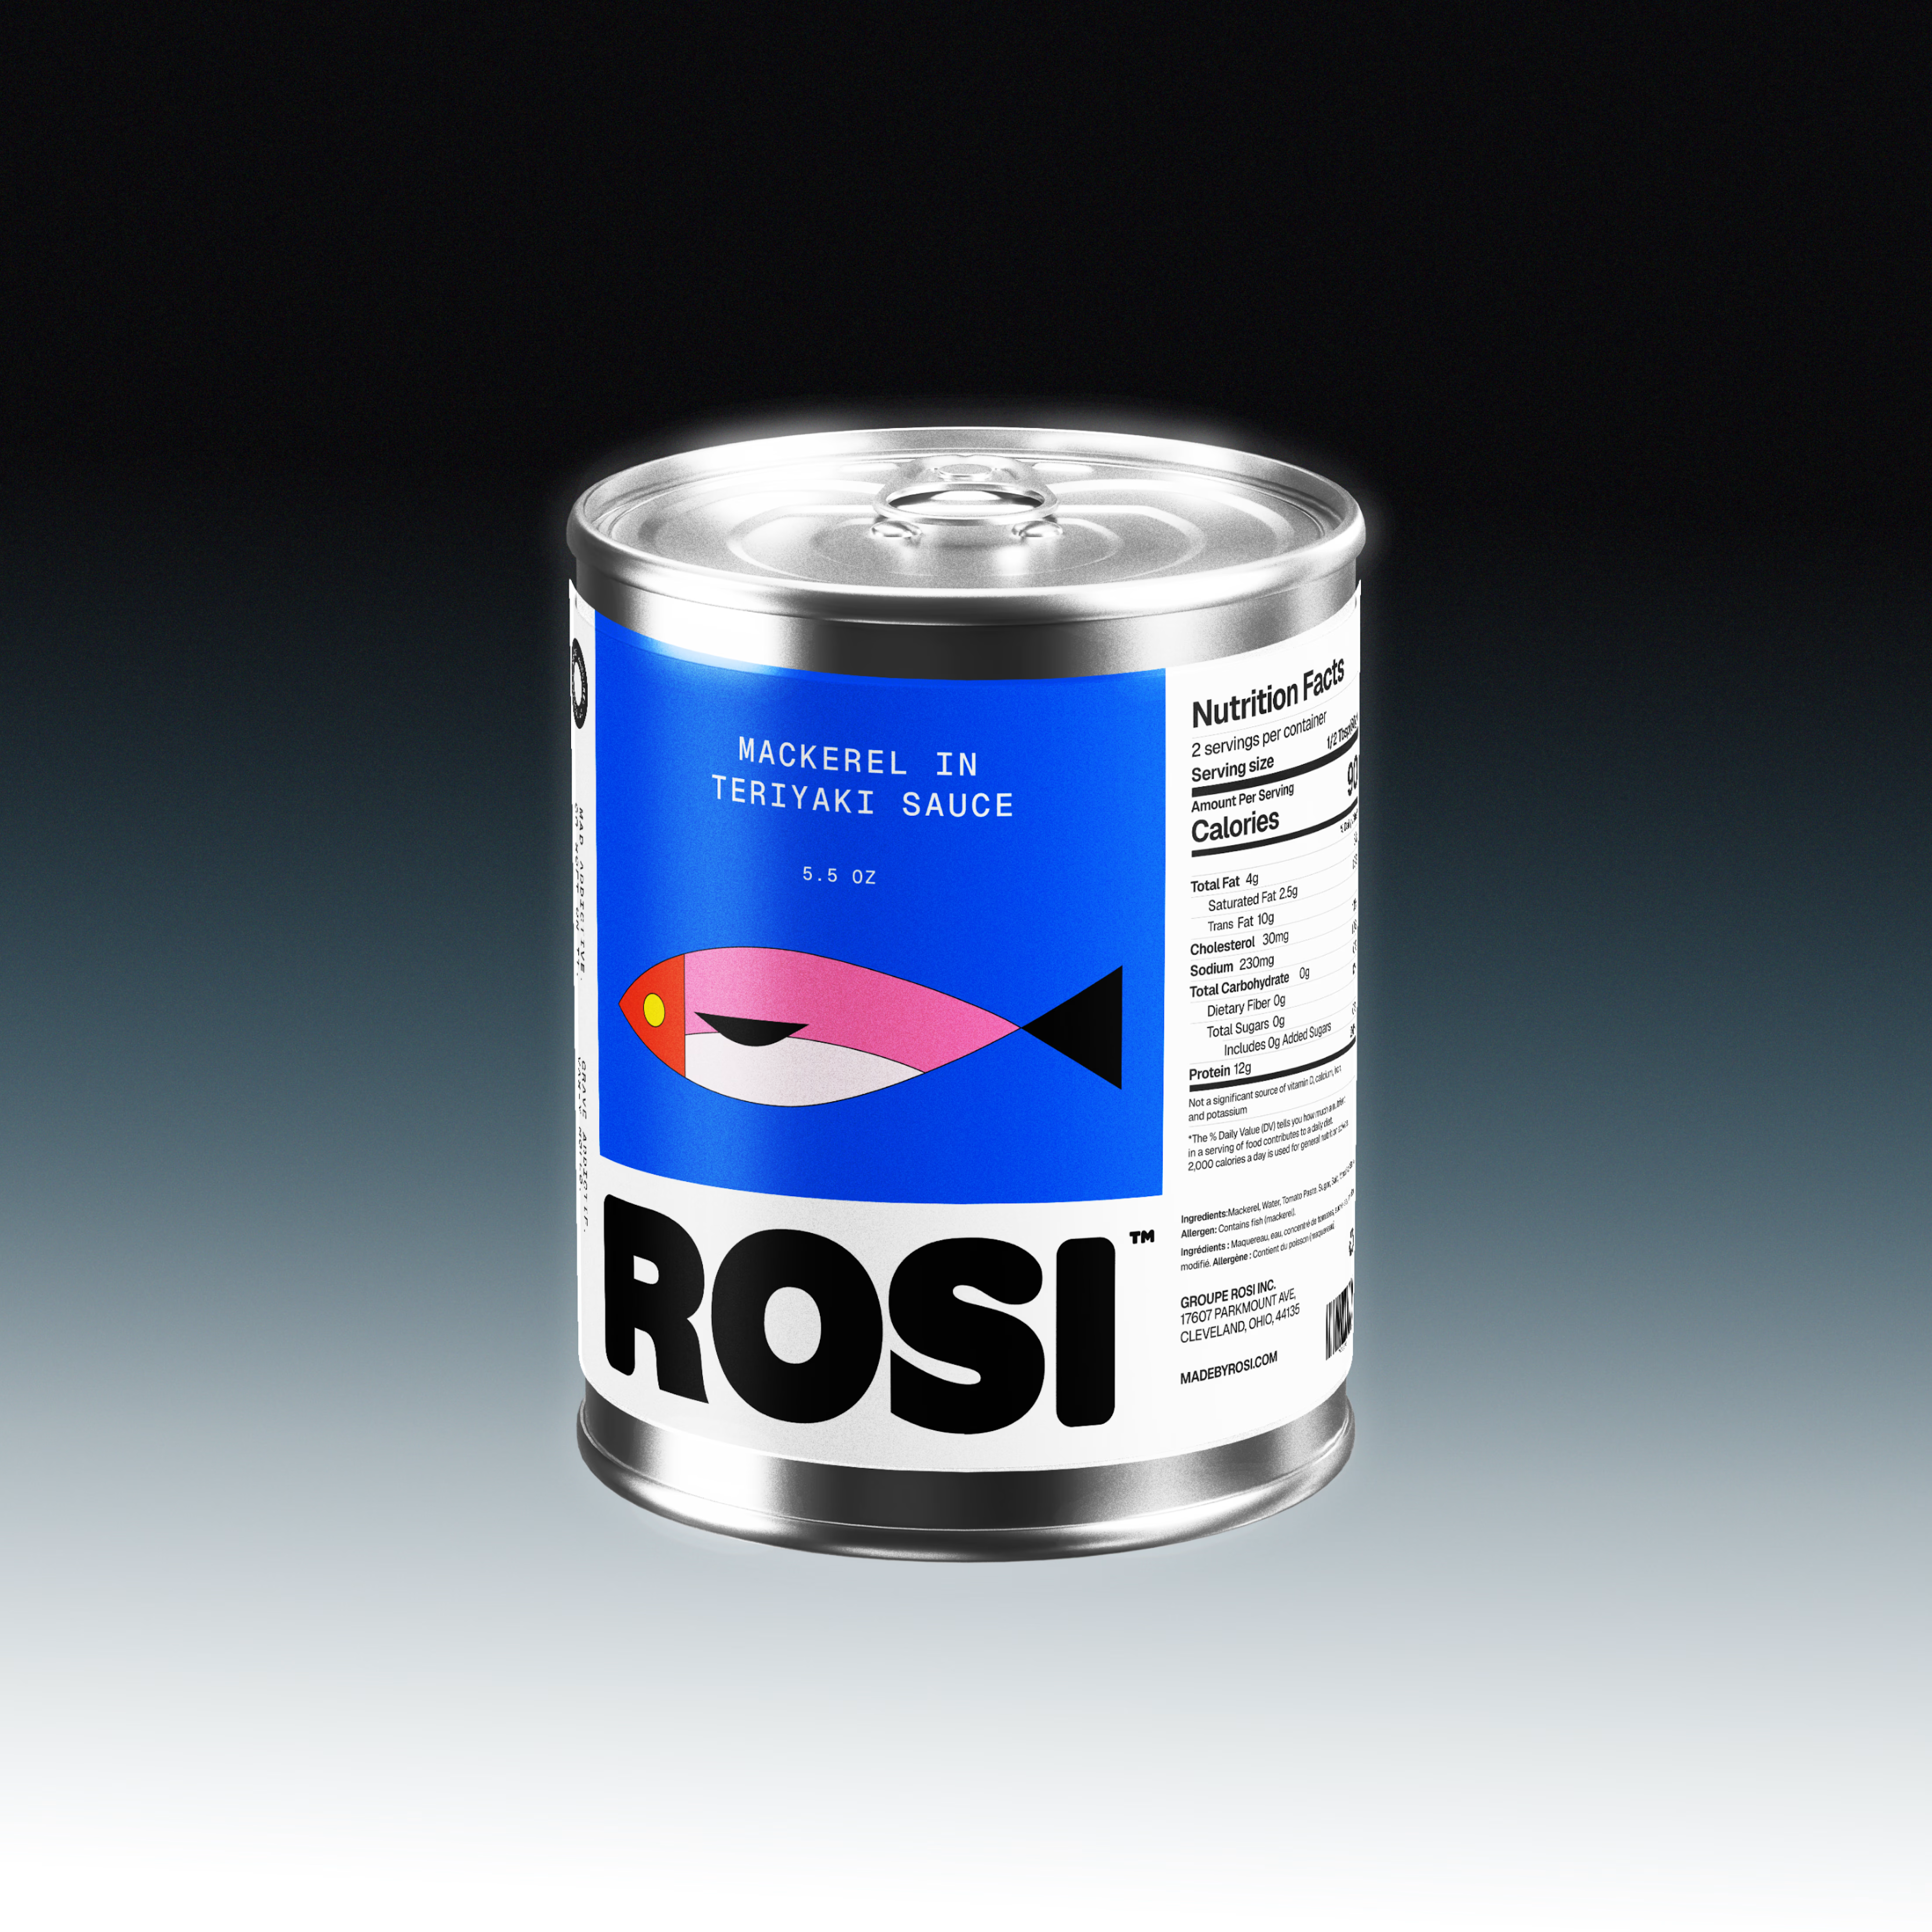
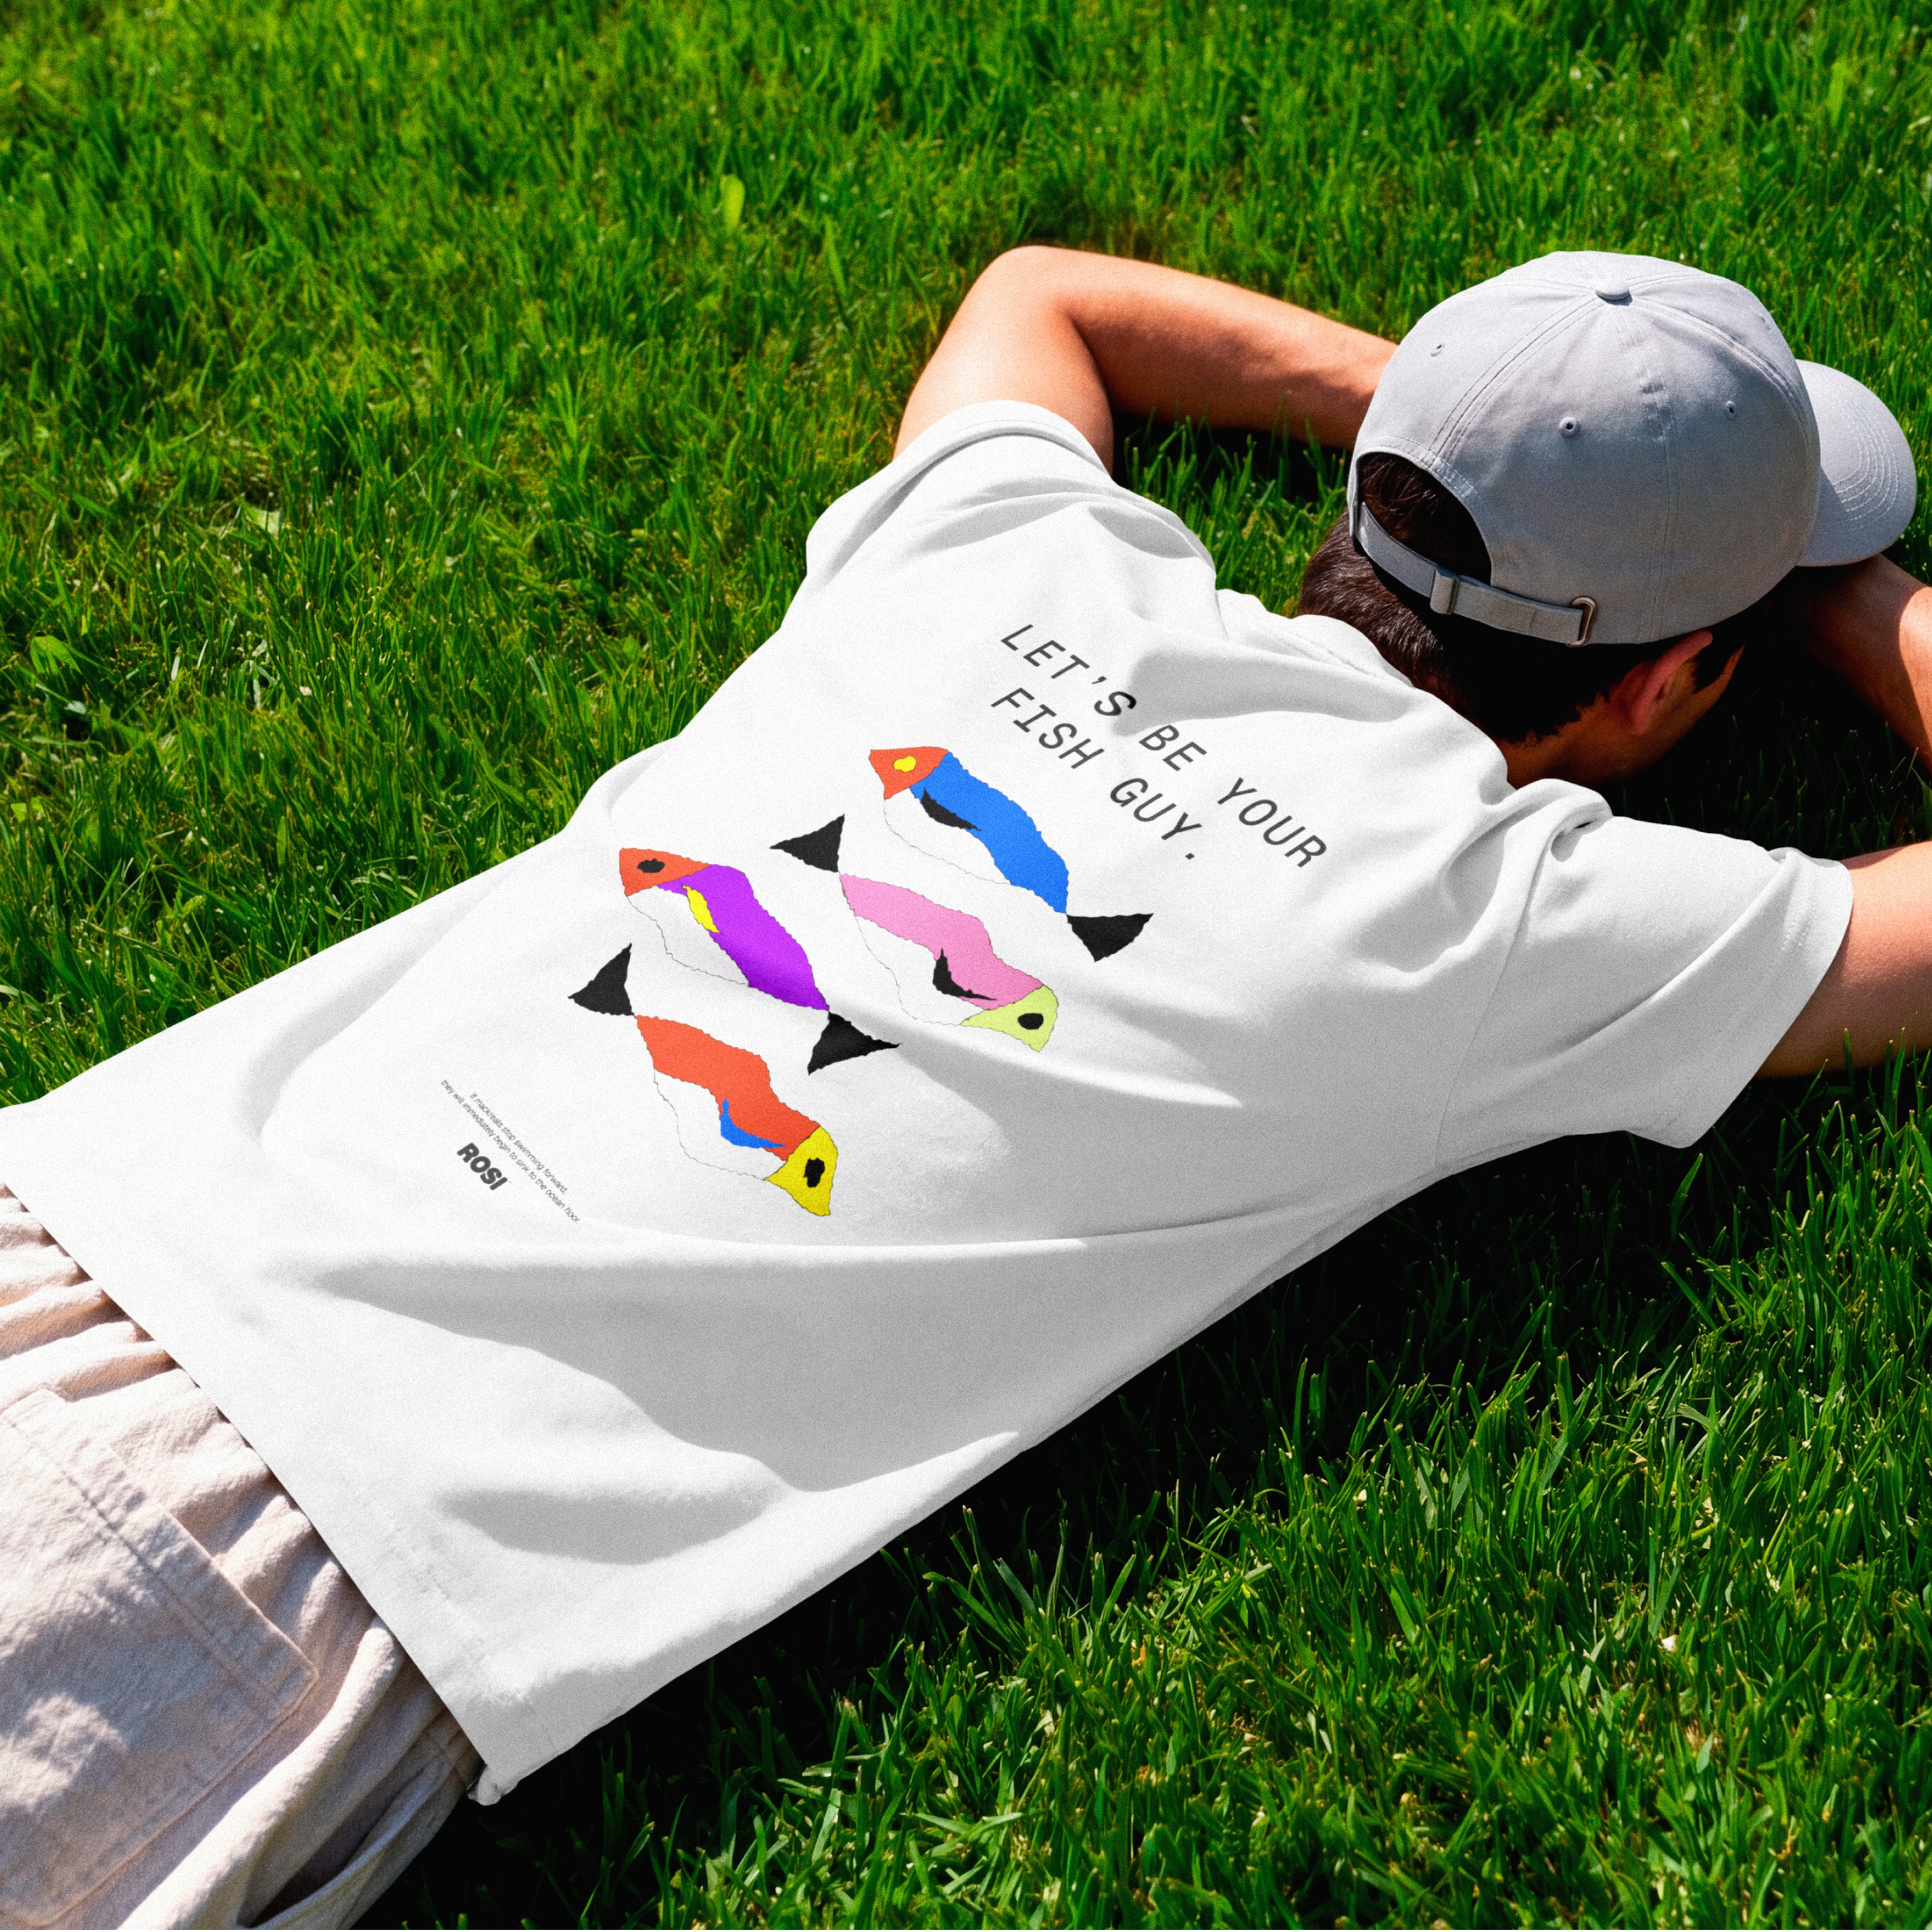

The ridiculously large wordmark is the entire personality, tinned fish has never strutted like this. Proof that confidence is a design decision, not a budget line.


Nice to see the feature section taking shape. Curious how it will connect to the rest of the template.