The network for creativity
Join 1.25M professional creatives like you
Connect with clients, get discovered, and run your business 100% commission-free
Creatives on Contra have earned over $150M and we are just getting started
Back to feedPost

This video demonstrates an interactive inventory analytics application designed to help operations teams monitor stock availability, identify supply shortages, and make informed replenishment decisions.
Using 16 populated synthetic inventory records, the walkthrough demonstrates how changes in stock quantities and supplier lead times automatically update inventory risk calculations.
What the Video Demonstrates
Inventory Dashboard: Displays stock availability, six stockout-risk items, and seven replenishment candidates.
Stockout Risk Detection: Identifies products that may run out before replacement inventory arrives.
Supplier Delay Simulation: Demonstrates how changing lead times affects replenishment calculations and risk exposure.
Interactive Inventory Management: Shows how stock adjustments immediately update dashboard metrics.
Replenishment Analytics: Calculates reorder points using demand, lead time, and safety stock.
Reporting: Provides calculated inventory results and export capabilities.
Technical Implementation
Developed the interactive dashboard, inventory calculation logic, scenario controls, risk filtering, and data import/export functionality using JavaScript, HTML5, and CSS3.
The demonstration showcases a functional inventory management analytics application with reproducible calculations and clearly identified synthetic data.


Nice work on the inventory dashboard.
Thank you, Vansita! I appreciate you taking the time to share your feedback. A big goal behind this inventory dashboard was to turn complex data into clear, actionable insights for faster decisions and smoother operations. Really glad to see the work resonates!
The network for creativity
Join 1.25M professional creatives like you
Connect with clients, get discovered, and run your business 100% commission-free
Creatives on Contra have earned over $150M and we are just getting started



Related posts

Photographer Portfolio Website
"Capturing light, emotion, and the moments you never want to forget." That line set the tone, and the layout follows it.
The hero is one motion-blurred portrait washed in red. The photographer's name runs across the bottom in a condensed white face, so large the screen cuts it off. The photo keeps its soft focus, and the name still reads first.
Thin grid lines split the page into narrow columns, and the small copy sits justified inside them. The loose photo gets a strict structure to lean on.
A single round red button with an arrow sits right on the letters and marks where to go next.
Designed by the Hue & Machine team.
#WebDesign #Photography #PortfolioWebsite #EditorialDesign #Typography #UIDesign #ProductDesign #CreativeDirection #ResponsiveDesign #FigmaDesign




The heavy condensed white FLORENCE over the red portrait is bold, and keeping the same red across phone, laptop and type tile makes the case study read as one system. Did the red come from the photographer's own work, or was it your call?


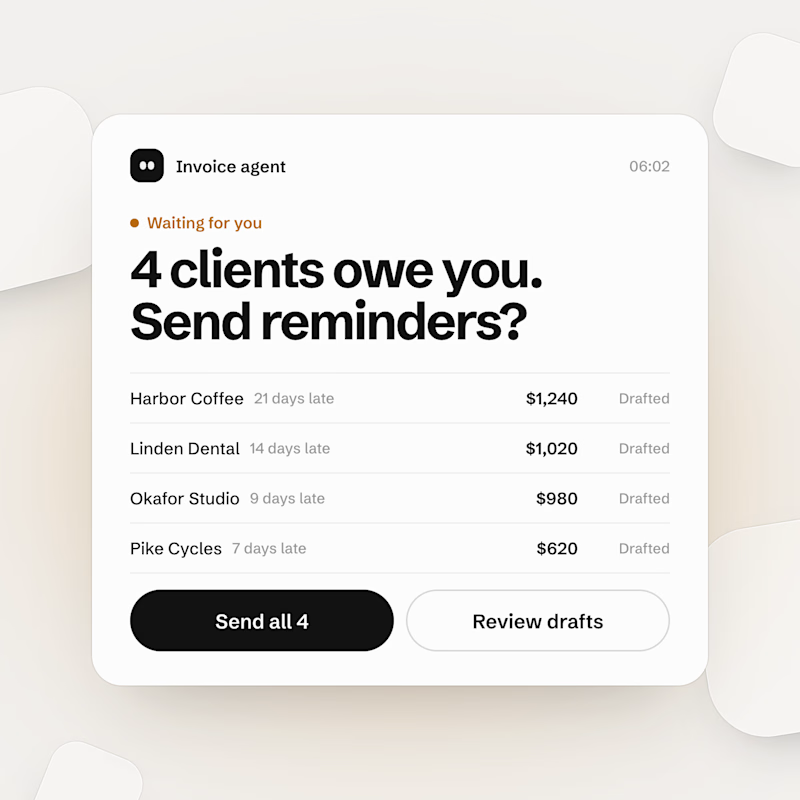
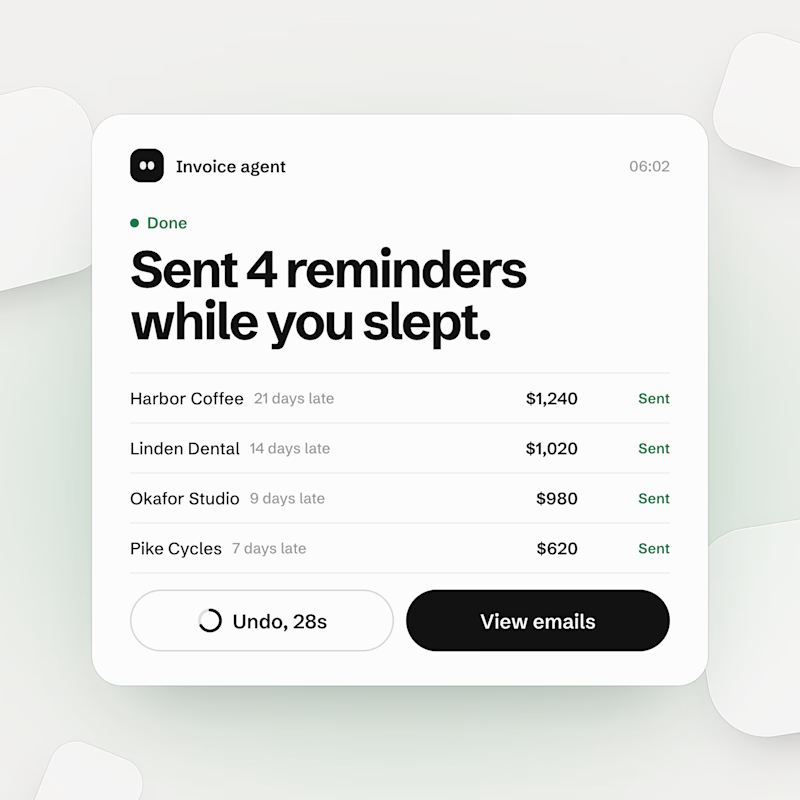
An AI agent that asks before everything is a to-do list with extra steps. One that never asks is an apology email waiting to happen.
Built both for a concept invoice agent. Same 4 late clients, same $3,860. Which one gets to email your clients, A or B?
2 voted
67%
1 voted
33%
3 votes
Closed