The network for creativity
Join 1.25M professional creatives like you
Connect with clients, get discovered, and run your business 100% commission-free
Creatives on Contra have earned over $150M and we are just getting started
Back to feedPost

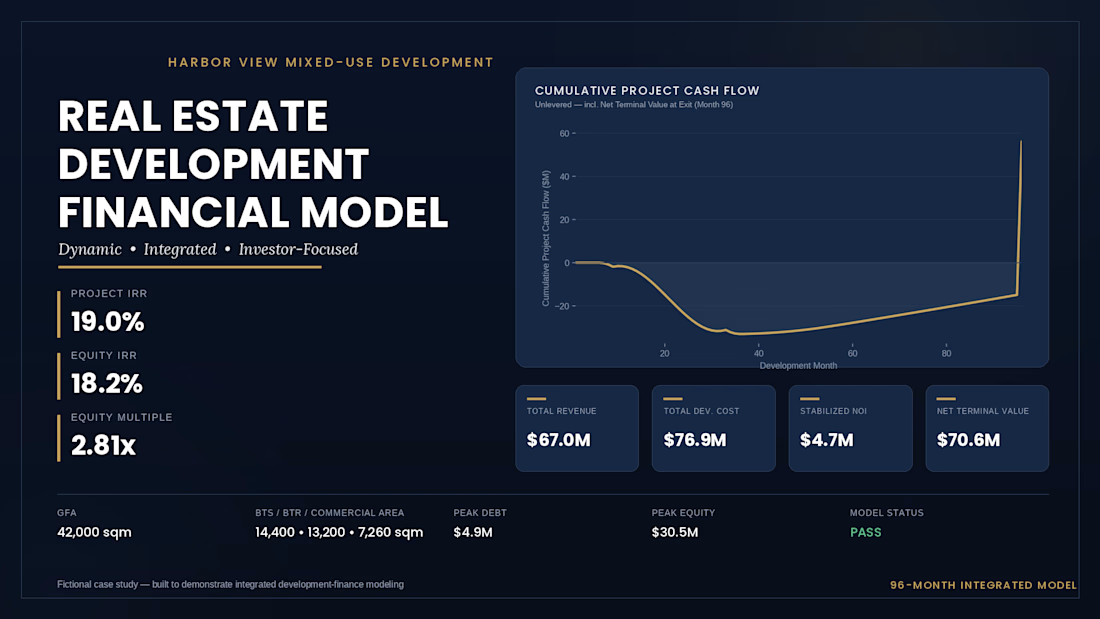
Real Estate Development Financial Model
A fully integrated Excel financial model designed to evaluate real estate development projects and support investment decisions.
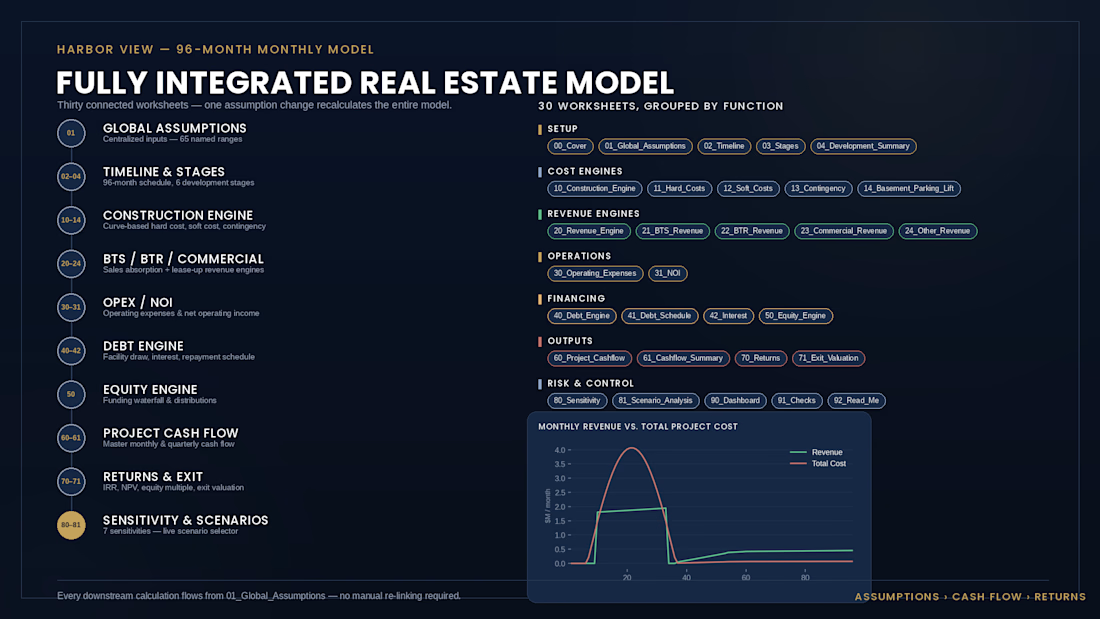
The model integrates development assumptions, construction costs, revenue projections, financing, project cash flow, and investment returns in one structured workbook.
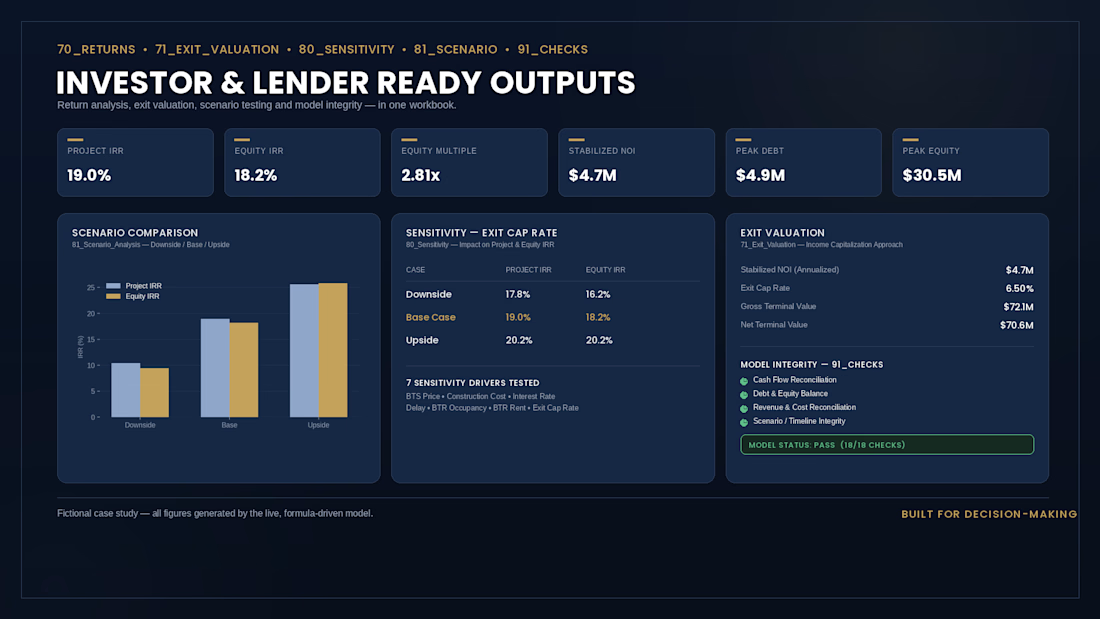
Key outputs include IRR, Equity IRR, NPV, Equity Multiple, peak debt, peak equity, exit value, cash flow analysis, and sensitivity analysis.
Built with a clear investor-focused dashboard to help developers, investors, and lenders quickly understand project performance, risks, and potential returns.
Tools: Microsoft Excel | Financial Modeling | Real Estate Analysis

The network for creativity
Join 1.25M professional creatives like you
Connect with clients, get discovered, and run your business 100% commission-free
Creatives on Contra have earned over $150M and we are just getting started
Related posts

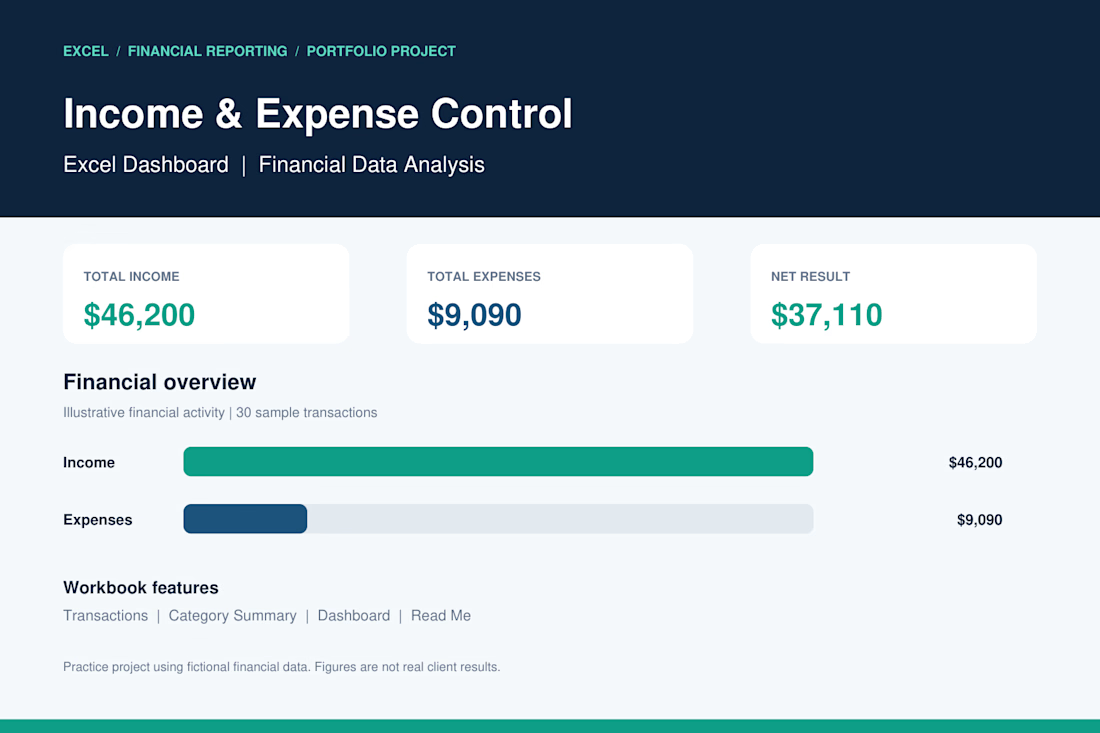
Income & Expense Control | Excel Dashboard
I developed a professional Excel dashboard as a portfolio practice project to demonstrate my skills in financial data management, income and expense tracking, and business reporting.
Project Features:
Automated income and expense calculations.
Financial dashboard with key performance indicators (KPIs).
Transaction tracking and organization.
Expense analysis by category.
Financial charts and visual reporting.
Net income calculation.
Project Results (Sample Data):
Total Income: $46,200
Total Expenses: $9,090
Net Result: $37,110
Tools: Microsoft Excel
Skills: Data Analysis, Accounting, Financial Reporting, Data Entry.
This project demonstrates my ability to organize financial records, analyze business performance, and create clear financial reports using Microsoft Excel.
Note: This is a portfolio demonstration using fictional financial data.

Great work 👏🏻

This interactive dashboard provides a comprehensive view of profit performance across multiple dimensions—time, segments, regions, categories, and sub‑categories.
This dashboard transforms raw business data into actionable insights by allowing stakeholders to quickly identify profitable areas, spot regional trends, and evaluate category performance. It’s designed for clarity, interactivity, and decision‑making support.

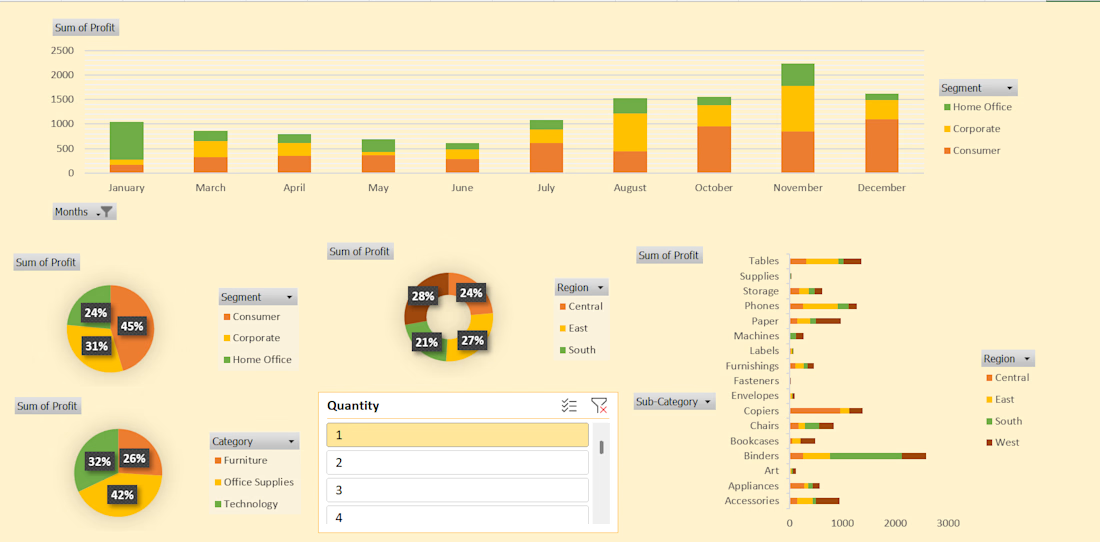
#This is an excellent Profit Dashboard which is made in MS Excel with multiple creative functions help in understanding Monthly , Yearly , Area wise Profits.

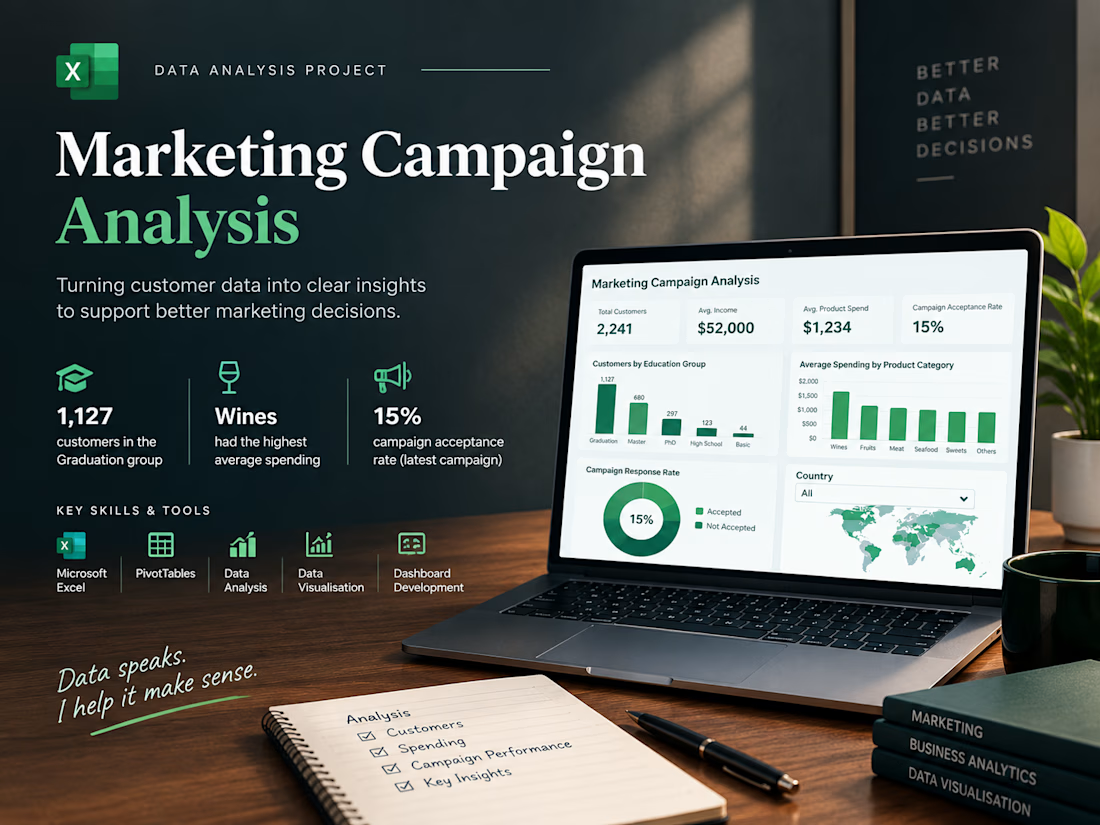
Marketing Campaign Data Analysis | Excel Dashboard & Business Insights
How well do you understand your customers, their spending habits, and the performance of your marketing campaigns?
Customer data can reveal valuable business insights, but making sense of that information requires proper analysis and clear visualization.
For this portfolio project, I worked with a marketing campaign dataset containing approximately 2,240 customer records to explore customer demographics, product spending patterns, and campaign acceptance.
What I analyzed:
📊 Customer distribution across education groups
📊 Average customer income
📊 Average spending across six product categories
📊 Marketing campaign acceptance and response rates
📊 Missing income values requiring further review
My approach:
✅ Organised and analysed customer data in Microsoft Excel
✅ Used PivotTables to summarise customer demographics and spending behaviour
✅ Created charts to compare product categories and customer groups
✅ Calculated key performance indicators (KPIs)
✅ Built an Excel dashboard with four charts and a country slicer
✅ Summarised the findings into concise, business-focused takeaways
Key findings:
🔹 Customer Demographics: Graduation was the largest education group, with 1,127 customers.
🔹 Product Spending: Wines recorded the highest average spending among the six product categories.
🔹 Campaign Performance: The latest marketing campaign achieved an acceptance rate of 15%.
Why does this analysis matter?
A well-structured dashboard helps businesses explore customer behaviour, compare spending patterns, and understand campaign results in one place.
These insights can help inform further investigation into customer segmentation and future marketing strategies.
Tools & Skills:
• Microsoft Excel
• Data Cleaning & Quality Checks
• PivotTables & Formulas
• Data Visualization
• KPI Reporting & Dashboard Development
I'm building my portfolio around practical data analysis and helping businesses turn spreadsheets into clear, useful insights.
Need help organizing your data, analyzing customer behaviour, or building an Excel dashboard? Feel free to get in touch!
#DataAnalytics #MicrosoftExcel #DataVisualization #ExcelDashboard #BusinessIntelligence #DataAnalysis