The network for creativity
Join 1.25M professional creatives like you
Connect with clients, get discovered, and run your business 100% commission-free
Creatives on Contra have earned over $150M and we are just getting started
Back to feedPost
This Financial Performance & Profitability Dashboard delivers a clear, executive-level view of revenue, profit, and growth trends across products, countries, and customer segments.
Built using Excel with BI-grade analytics, the dashboard tracks monthly sales vs profit, identifies high-margin products, evaluates country-wise profitability, and compares performance across enterprise, government, midmarket, and SMB segments. Interactive filters enable fast drill-downs by year, region, and segment for decision-making at scale.
Designed for finance leaders and business stakeholders, this dashboard supports profit optimization, strategic planning, and performance monitoring.
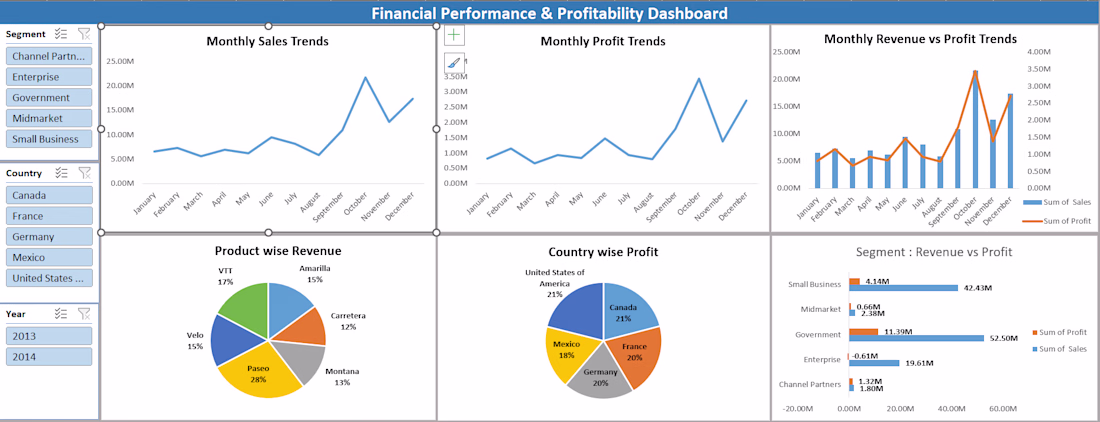
Strong executive framing here. I especially like the segmentation by country and customer group — that’s where profitability conversations usually shift from “total revenue” to “quality of revenue.”
Out of curiosity, do stakeholders focus more on margin trends or variance vs targets when reviewing this dashboard?
The network for creativity
Join 1.25M professional creatives like you
Connect with clients, get discovered, and run your business 100% commission-free
Creatives on Contra have earned over $150M and we are just getting started
Related posts
🚀 Built a Fully Automated Transaction Entry Tracker-Finance System in Excel (VBA + UserForm)
Excited to share a project I recently completed using Microsoft Excel automation.
🔹 UserForm-based transaction entry
🔹 Income & Expense tracking with dependent categories
🔹 Automatic Entry ID, Date, Month & Year capture
🔹 Expense logic enforced (negative values)
🔹 Clean, user-friendly UI with color-coded actions
🔹 One-click save with data validation
🔹 Structured backend for dashboards & reports
This solution transforms Excel from a simple spreadsheet into a finance tracking system...
The project was designed with:
Data accuracy
User experience
Scalability for dashboards & reporting
Training & real-world usability in mind.
#ExcelAutomation #VBA #UserForm #FinanceTracking
#ExcelProjects #DataManagement #LearningByDoing #microsoft
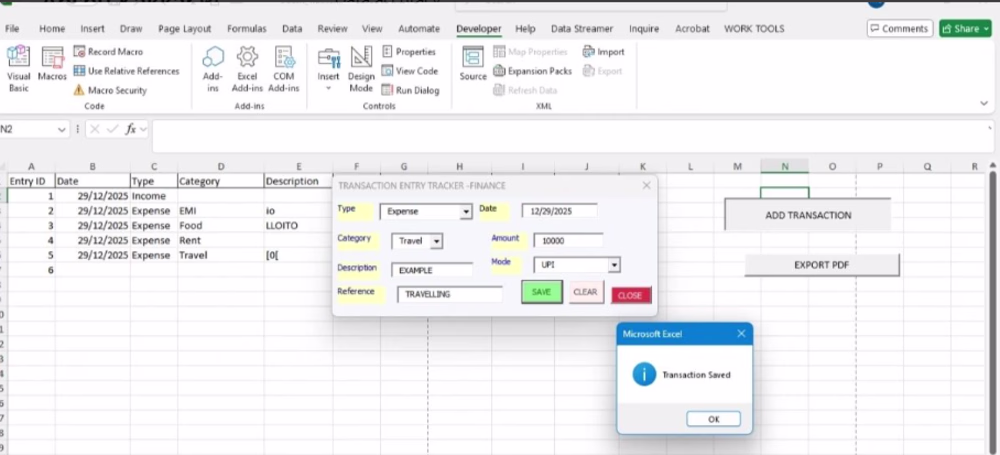
The dependent category logic combined with automatic negative value enforcement for expenses is exactly the kind of guardrail that prevents data entry errors before they reach the dashboard — most trackers skip this and end up with messy backends that break reporting. The...
Prepared and analyzed balance sheets for Nexus Capital Group by organizing financial records, reviewing assets and liabilities, reconciling accounts, and ensuring accurate financial reporting to support business decision-making and financial transparency
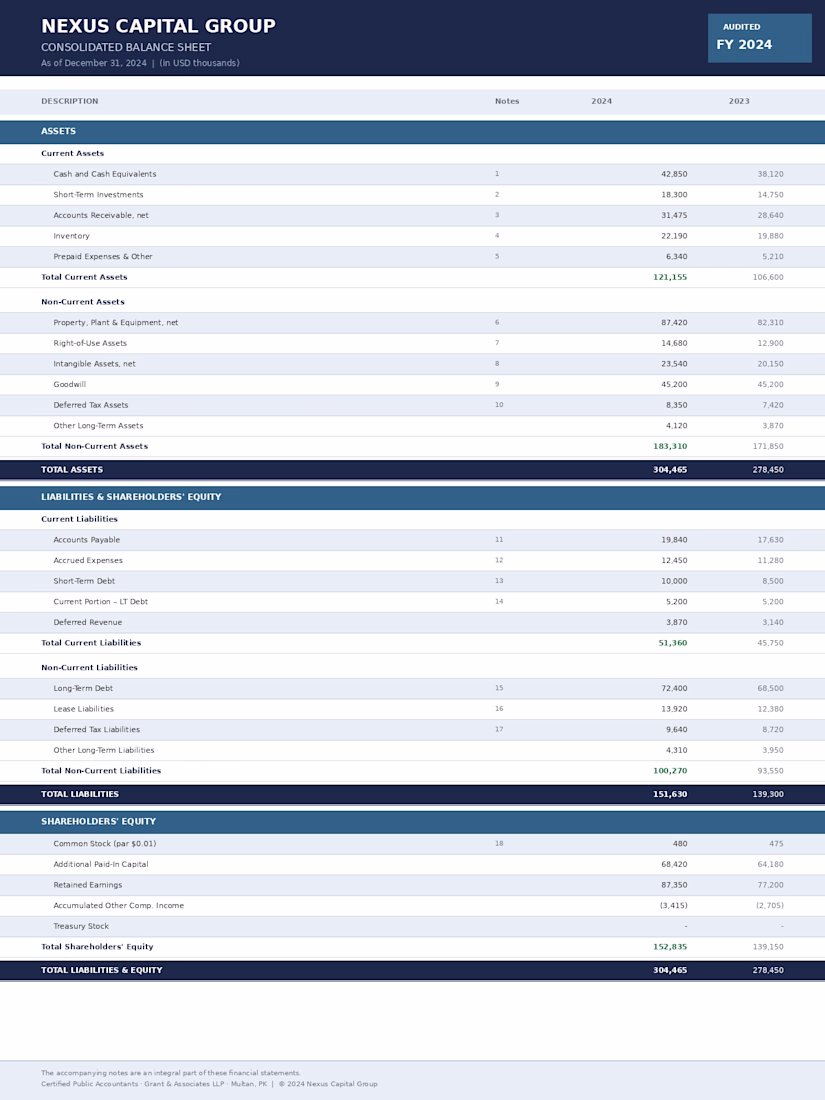
The side-by-side FY2024 vs FY2023 comparison is what makes this immediately useful for decision-making — you can see the movement in accounts receivable and long-term debt at a glance without digging through separate reports. The distinction between current and non-current...
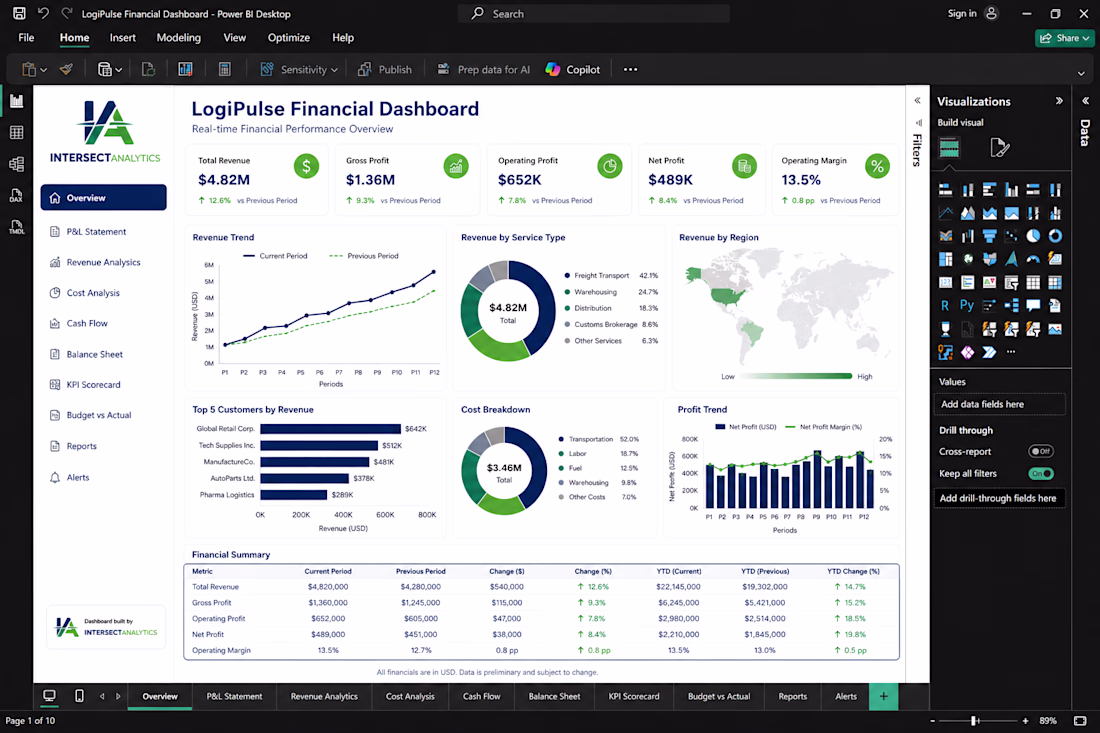
🚛 Transform Logistics Data Into Profitable Decisions with Intersect Analytics
At Intersect Analytics, we help logistics and supply chain businesses turn complex operational data into powerful business intelligence dashboards using Power BI, Excel, Google Sheets, and advanced analytics solutions.
📊 In this Logistics Financial Dashboard project, we delivered:
✔ Real-time Revenue & Profitability Tracking
✔ P&L Statement Analytics
✔ Cost Analysis & Operational Expense Monitoring
✔ Revenue Trend & Regional Performance Insights
✔ KPI Scorecards & Executive Reporting
✔ Customer Revenue Segmentation
✔ Interactive Power BI Reporting Environment
🔍 Key Business Findings:
• Revenue growth increased by 12.6% through service performance optimization
• High transportation costs were identified as the largest expense driver
• Regional profitability analysis exposed underperforming markets
• Customer revenue concentration revealed top-performing accounts contributing the majority of revenue
• Profit margin trends enabled faster strategic decision-making
💡 Outcomes Delivered:
✅ Improved financial visibility
✅ Faster executive reporting
✅ Data-driven operational planning
✅ Enhanced profitability analysis
✅ Better forecasting and budgeting decisions
✅ Centralized reporting for management teams
Whether you're in logistics, retail, healthcare, manufacturing, or finance — we build professional dashboards that help businesses monitor KPIs, automate reporting, and uncover growth opportunities.
Our Services:
🔹 Power BI Dashboard Development
🔹 Financial Analytics & Reporting
🔹 Advanced Excel & Google Sheets Automation
🔹 Business Intelligence Solutions
🔹 KPI & Executive Dashboard Design
🔹 Data Cleaning & Transformation
🔹 SQL & Data Modeling
🔹 Forecasting & Financial Modeling
📈 Stop guessing. Start making decisions backed by data.
Intersect Analytics — Bridging Data, Finance & Business Growth.
Trending
Claude
Claude has entered the design space. How are you using Claude Design?
Contra University
Learn from expert creatives how to earn more using next-gen AI tools.
creativeaiflow
Creative AI workflows are evolving. What tools do you use, and what are their strengths and weaknesses?
portfolioreview
The best portfolios tell a story, not just show a grid. Share yours for feedback.
freelancerlife
Freelancer life is wins, pivots, and everything in between. What’s yours right now?