The network for creativity
Join 1.25M professional creatives like you
Connect with clients, get discovered, and run your business 100% commission-free
Creatives on Contra have earned over $150M and we are just getting started
Back to feedPost
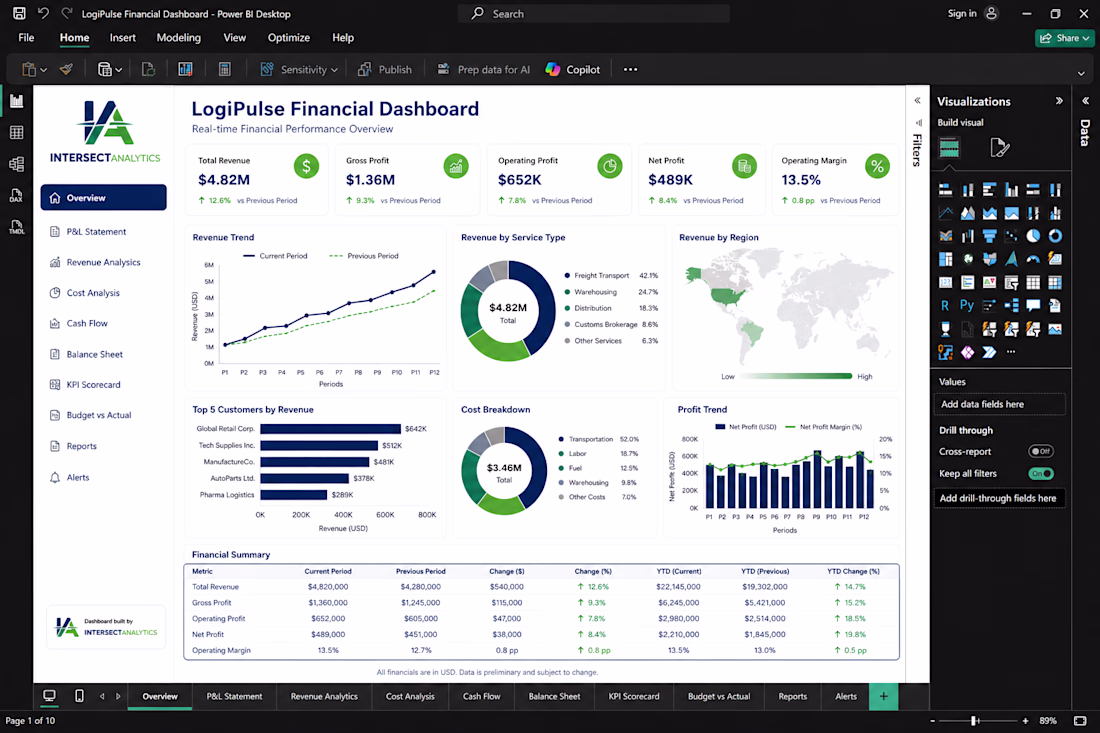
🚛 Transform Logistics Data Into Profitable Decisions with Intersect Analytics
At Intersect Analytics, we help logistics and supply chain businesses turn complex operational data into powerful business intelligence dashboards using Power BI, Excel, Google Sheets, and advanced analytics solutions.
📊 In this Logistics Financial Dashboard project, we delivered:
✔ Real-time Revenue & Profitability Tracking
✔ P&L Statement Analytics
✔ Cost Analysis & Operational Expense Monitoring
✔ Revenue Trend & Regional Performance Insights
✔ KPI Scorecards & Executive Reporting
✔ Customer Revenue Segmentation
✔ Interactive Power BI Reporting Environment
🔍 Key Business Findings:
• Revenue growth increased by 12.6% through service performance optimization
• High transportation costs were identified as the largest expense driver
• Regional profitability analysis exposed underperforming markets
• Customer revenue concentration revealed top-performing accounts contributing the majority of revenue
• Profit margin trends enabled faster strategic decision-making
💡 Outcomes Delivered:
✅ Improved financial visibility
✅ Faster executive reporting
✅ Data-driven operational planning
✅ Enhanced profitability analysis
✅ Better forecasting and budgeting decisions
✅ Centralized reporting for management teams
Whether you're in logistics, retail, healthcare, manufacturing, or finance — we build professional dashboards that help businesses monitor KPIs, automate reporting, and uncover growth opportunities.
Our Services:
🔹 Power BI Dashboard Development
🔹 Financial Analytics & Reporting
🔹 Advanced Excel & Google Sheets Automation
🔹 Business Intelligence Solutions
🔹 KPI & Executive Dashboard Design
🔹 Data Cleaning & Transformation
🔹 SQL & Data Modeling
🔹 Forecasting & Financial Modeling
📈 Stop guessing. Start making decisions backed by data.
Intersect Analytics — Bridging Data, Finance & Business Growth.
The network for creativity
Join 1.25M professional creatives like you
Connect with clients, get discovered, and run your business 100% commission-free
Creatives on Contra have earned over $150M and we are just getting started
Related posts
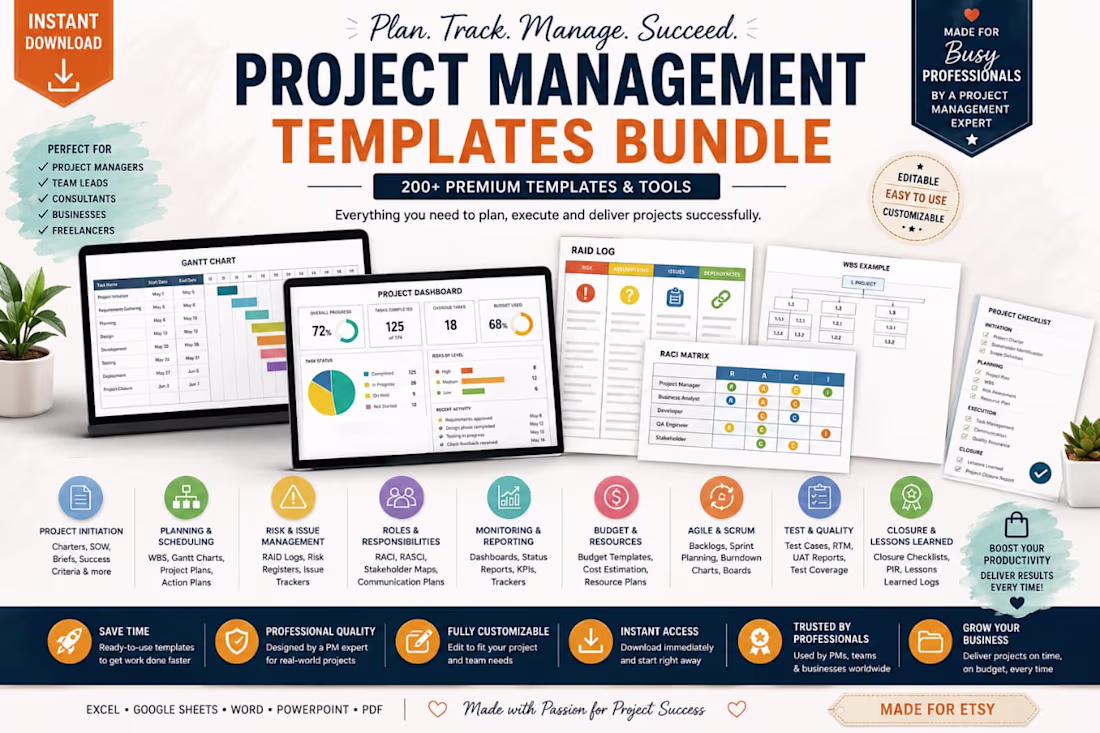
Premium, ready-to-use project management and business analysis toolkits that help professionals, consultants, and teams save time, standardize delivery, and execute projects with confidence.
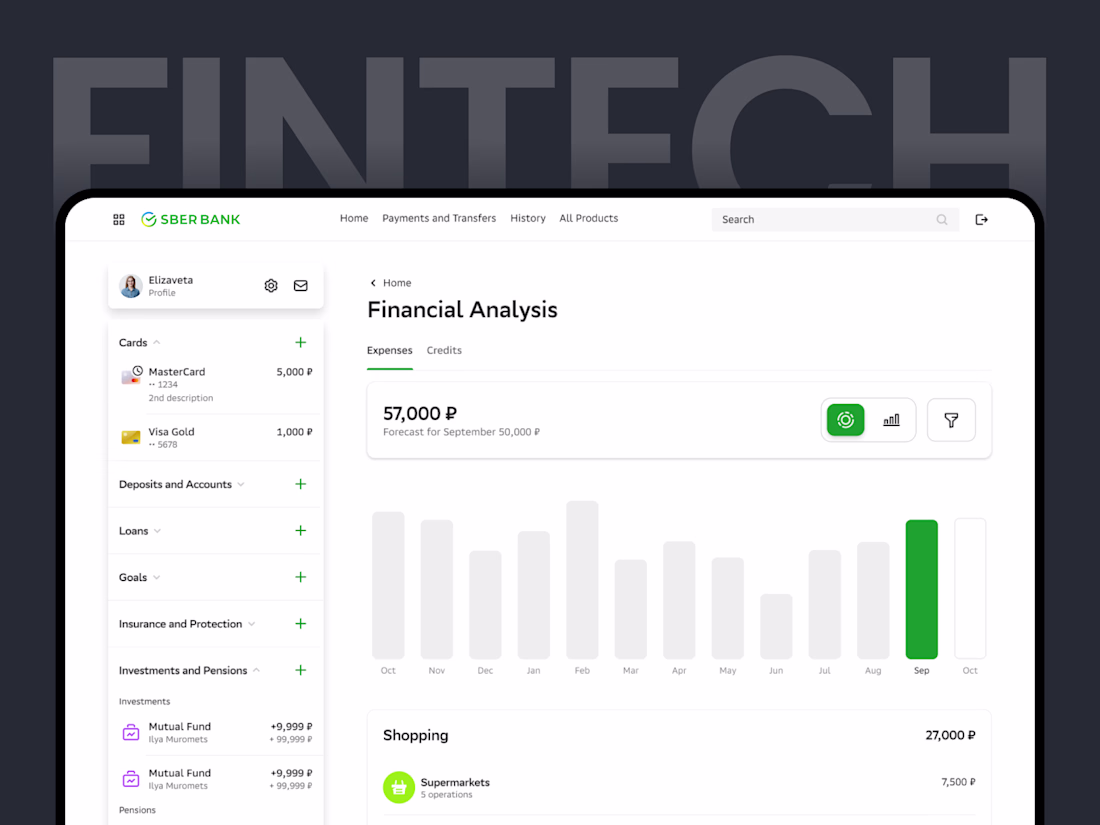
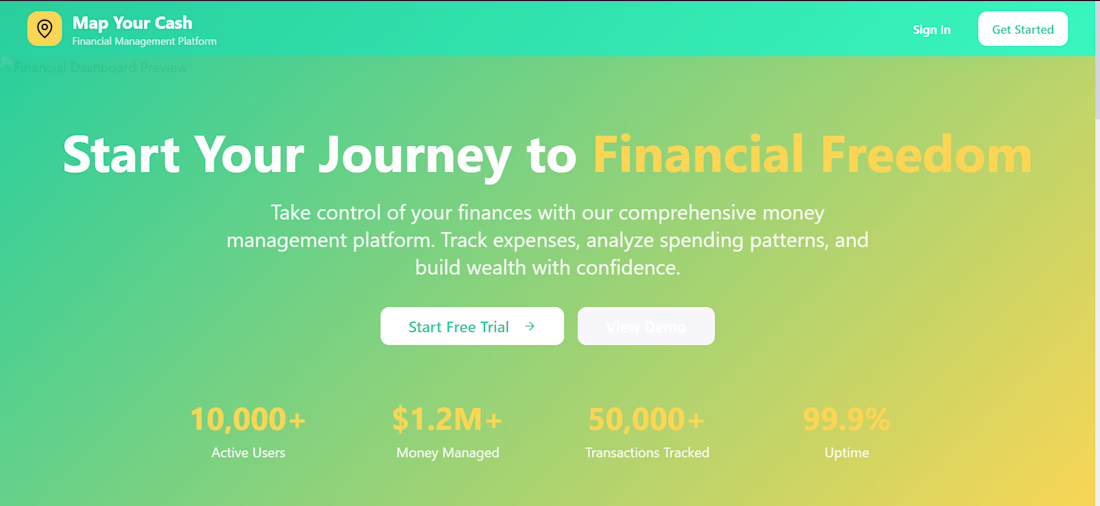
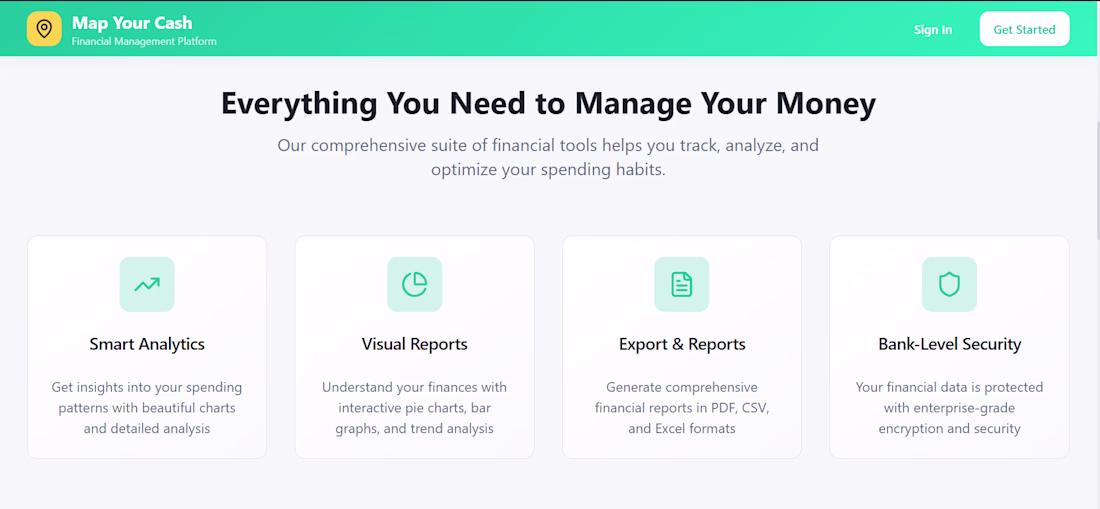
🚀 UI Design Project: Map Your Cash — Financial Management Platform
I designed a clean and modern financial management dashboard concept called Map Your Cash, built to help users track income, expenses, savings, transactions, and financial reports from one simple interface.
The goal was to create a platform that feels:
✅ Professional
✅ Easy to navigate
✅ Visually clean
✅ Trustworthy for financial data
✅ Useful for both personal and small business finance tracking
Key screens designed:
• Landing page with strong call-to-action
• Feature section explaining the platform value
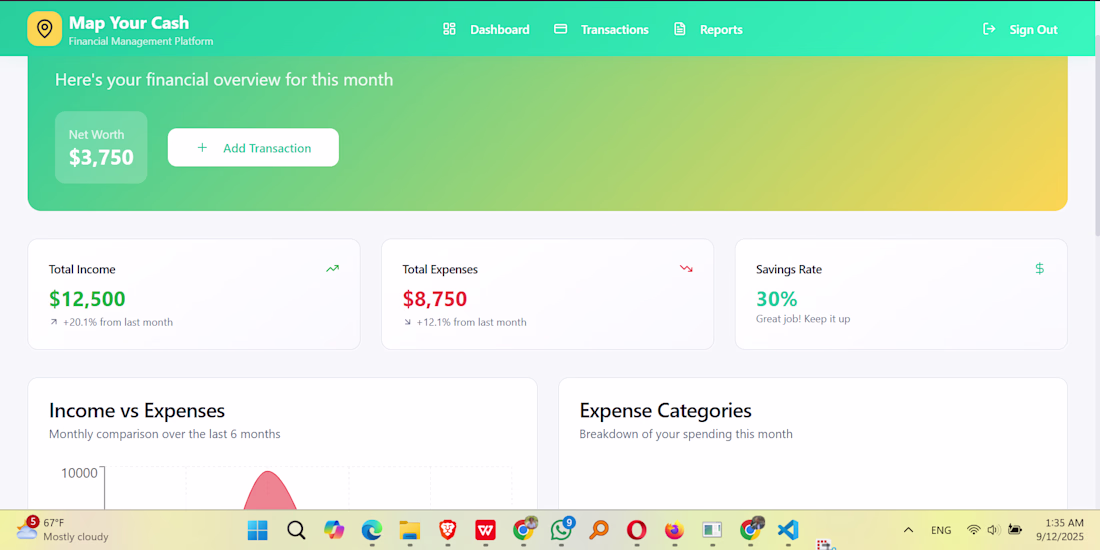
• Dashboard overview with income, expenses, savings rate, and net worth
• Transaction management page
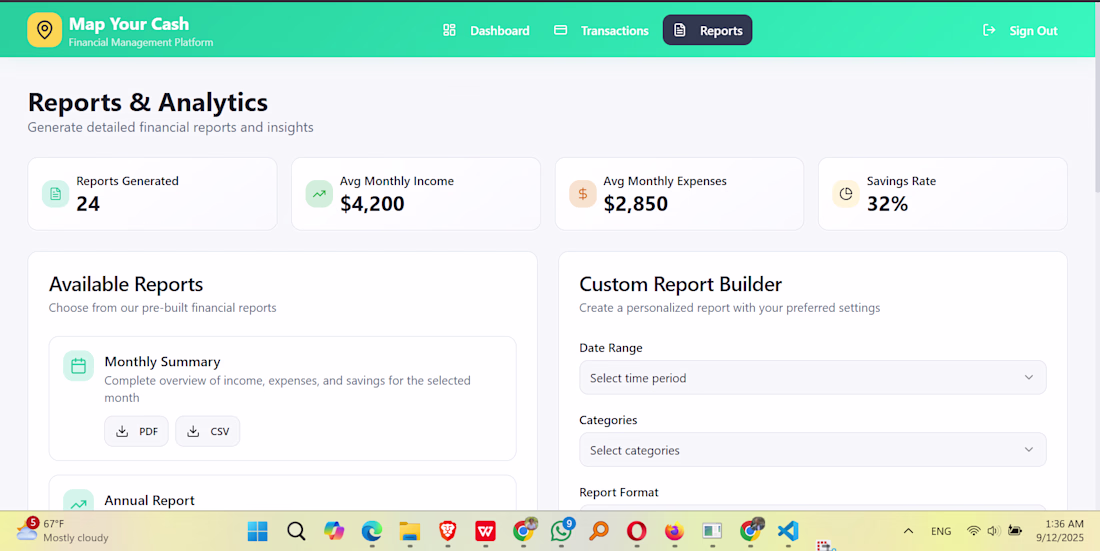
• Reports and analytics page
• Export/report generation interface
Design focus:
• Clear visual hierarchy
• Smooth navigation between dashboard, transactions, and reports
• Strong brand identity using teal, yellow, white, and dark navy
• Simple cards for financial summaries
• User-friendly layout for quick decision-making
This project helped me demonstrate my ability to design SaaS-style dashboards, financial interfaces, landing pages, and user-focused web applications.
Tools/Skills used:
UI Design
Dashboard Design
SaaS Design
Web App Design
Responsive Layout
Financial Platform Design
Frontend Implementation
I’m available to help startups, small businesses, and founders design clean web apps, dashboards, landing pages, and MVP interfaces.
Trending
Claude
Claude has entered the design space. How are you using Claude Design?
Contra University
Learn from expert creatives how to earn more using next-gen AI tools.
creativeaiflow
Creative AI workflows are evolving. What tools do you use, and what are their strengths and weaknesses?
portfolioreview
The best portfolios tell a story, not just show a grid. Share yours for feedback.
freelancerlife
Freelancer life is wins, pivots, and everything in between. What’s yours right now?