
Aditya Kumar
Data Analyst | Power BI Dashboards & SQL Insights for Sales
New to Contra
Aditya is ready for their next project!

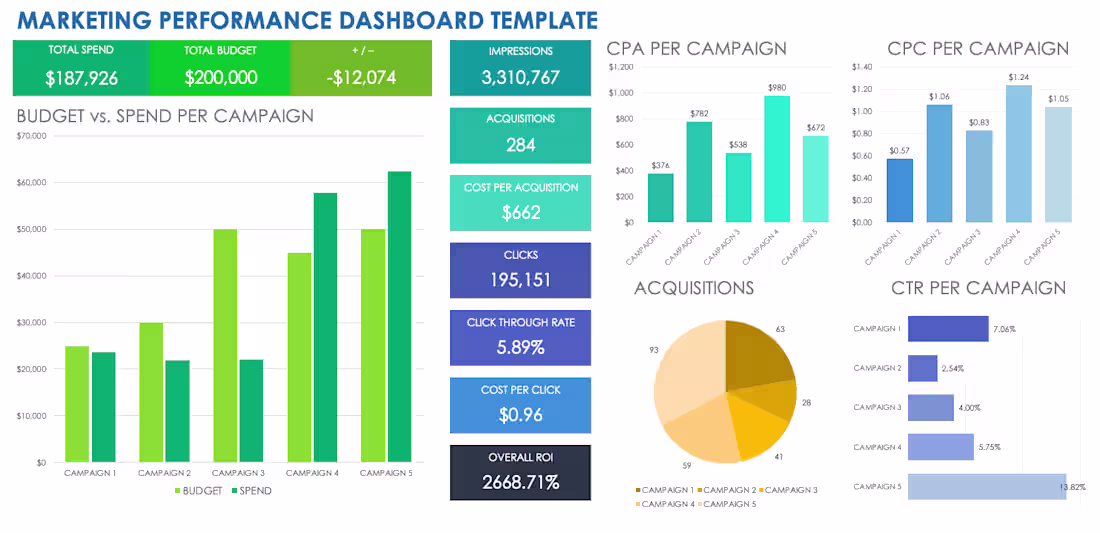
This Customer & Marketing Analytics Dashboard turns customer and campaign data into actionable insights for acquisition, retention, and ROI optimization.
It analyzes customer segments, repeat vs new customers, campaign performance, conversion trends, and revenue contribution by channel. The dashboard enables marketing teams to quickly identify high-value customers and underperforming campaigns.
Built for data-driven marketing decisions, it supports budget optimization, targeting strategy, and growth planning through clear visual storytelling.
4
119
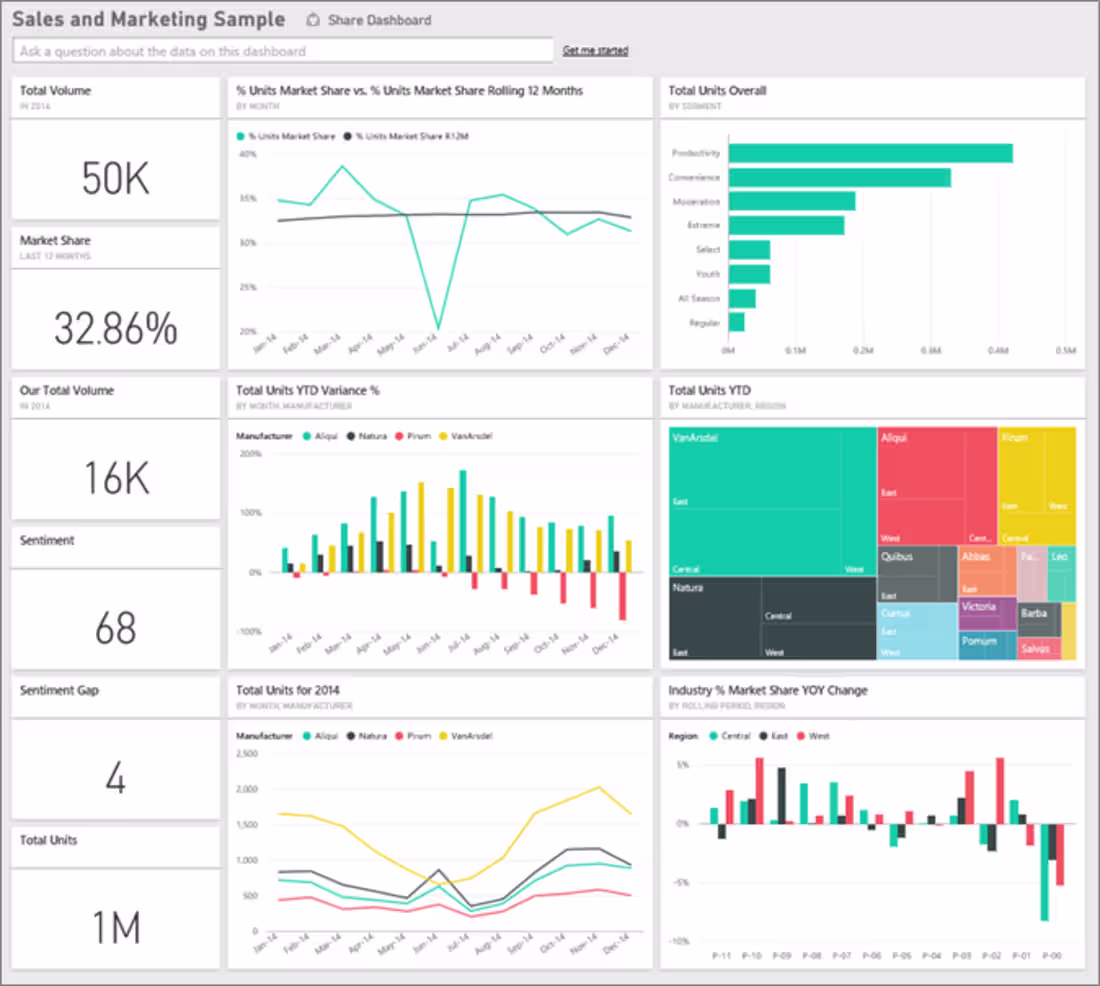
This Sales & Growth Performance Dashboard provides leadership with a clear, real-time view of revenue trends, growth drivers, and sales efficiency.
The dashboard tracks monthly revenue, growth trends, top-performing products, regional performance, and sales contribution by channel. Designed for executive decision-making, it highlights what’s driving growth—and what needs immediate attention.
Interactive filters allow stakeholders to drill down by time period, region, and product, making it ideal for forecasting, sales planning, and performance reviews.
1
3
118
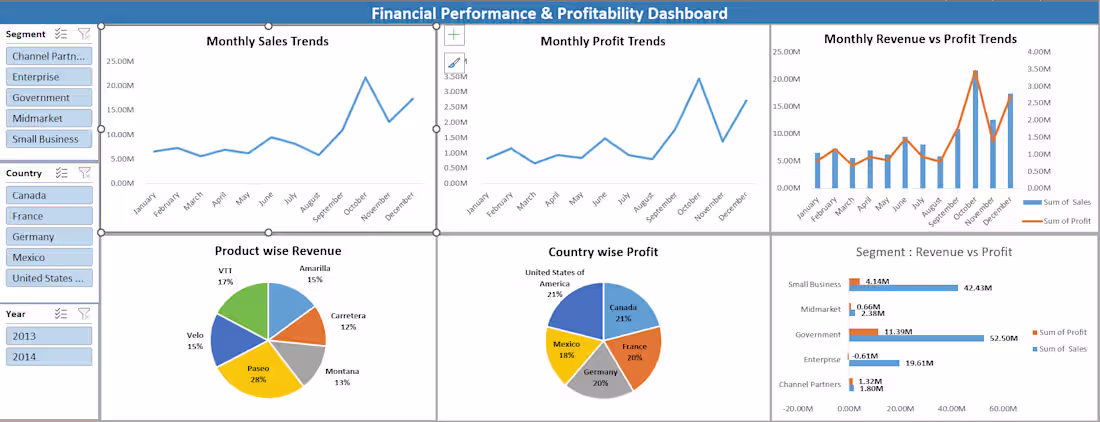
This Financial Performance & Profitability Dashboard delivers a clear, executive-level view of revenue, profit, and growth trends across products, countries, and customer segments.
Built using Excel with BI-grade analytics, the dashboard tracks monthly sales vs profit, identifies high-margin products, evaluates country-wise profitability, and compares performance across enterprise, government, midmarket, and SMB segments. Interactive filters enable fast drill-downs by year, region, and segment for decision-making at scale.
Designed for finance leaders and business stakeholders, this dashboard supports profit optimization, strategic planning, and performance monitoring.
1
2
120
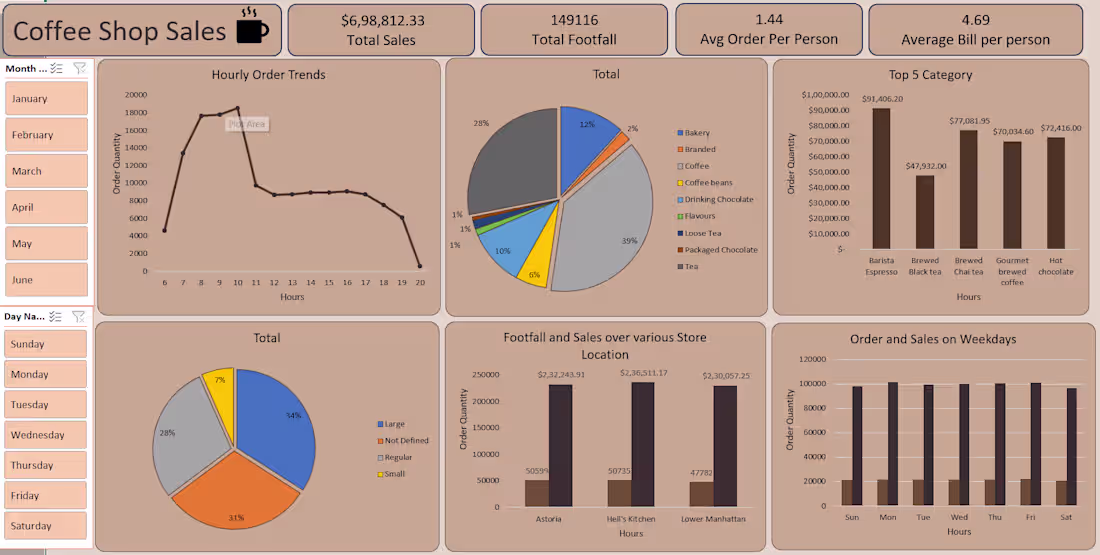
This Coffee Shop Sales Dashboard converts raw transaction data into decision-ready insights for revenue growth. Built using Excel with BI-level reporting, it tracks sales, footfall, order value, and peak-hour demand.
The dashboard delivers clear visibility across products, locations, weekdays, and order sizes, enabling smarter staffing, inventory control, and pricing decisions. Fully interactive and designed for fast executive-level analysis.
Tools used: Excel (advanced analytics), SQL logic, BI visualization.
1
3
121