The network for creativity
Join 1.25M professional creatives like you
Connect with clients, get discovered, and run your business 100% commission-free
Creatives on Contra have earned over $150M and we are just getting started
Back to feedPost
Project Title
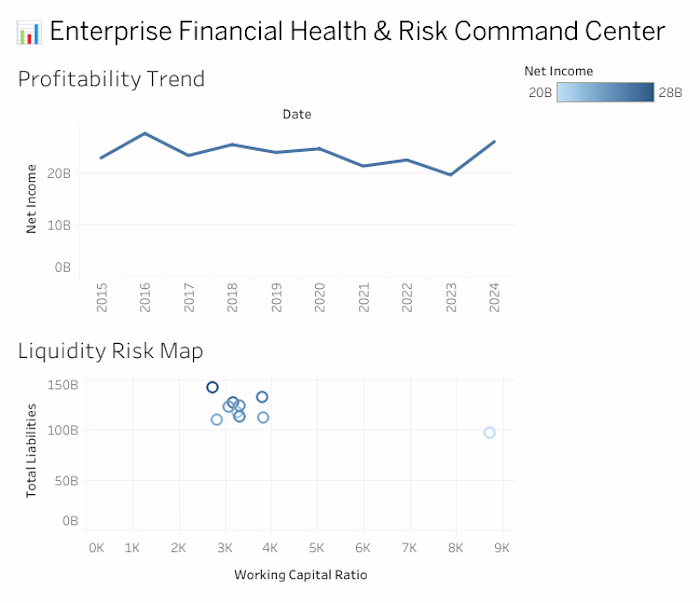
Enterprise Financial Health & Risk Command Center
Project Overview
Engineered a comprehensive, interactive business intelligence dashboard using raw corporate financial datasets sourced from Kaggle. The goal of this project was to establish a centralized "Command Center" that bridges operational bottom-line metrics with enterprise balance sheet liabilities for high-level executive review.
The Technical & Analytical Process
Data Engineering & Preparation: Processed, extracted, cleaned, and structured unorganized raw financial logs to build a reliable data model mapping Net Income timelines against liability structures.
Interactive Risk Mapping: Designed custom action filters within a scatter plot framework. As shown in "Dashboard 1 (1).png", this allows stakeholders to actively select specific liquidity risk outliers on the Liquidity Risk Map (comparing Total Liabilities against Working Capital Ratio) to instantly filter and update corresponding multi-year Profitability Trends.
C-Suite Design Standards: Optimized the dashboard layout using a minimalist, corporate-friendly color palette (structured around graded blue-scale metrics for Net Income ranges from 20B to 28B) ensuring the visual assets meet strict presentation standards for executive board reviews.
The network for creativity
Join 1.25M professional creatives like you
Connect with clients, get discovered, and run your business 100% commission-free
Creatives on Contra have earned over $150M and we are just getting started
Related posts
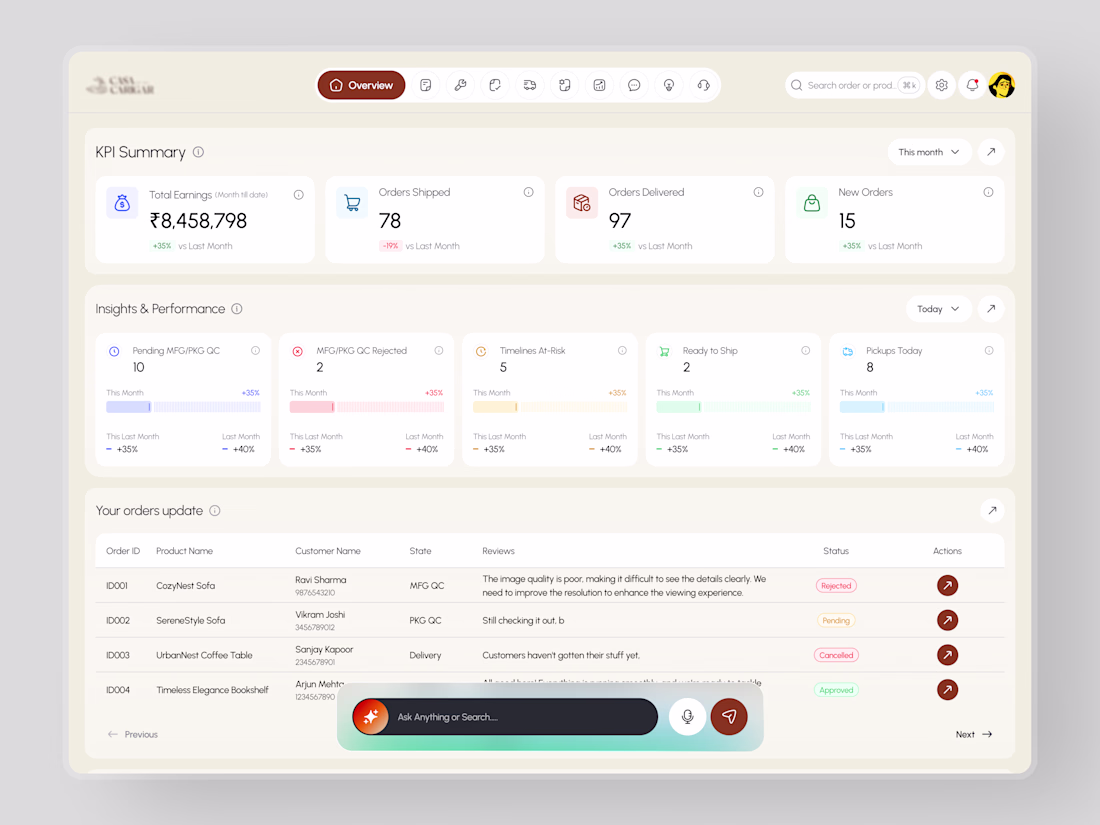
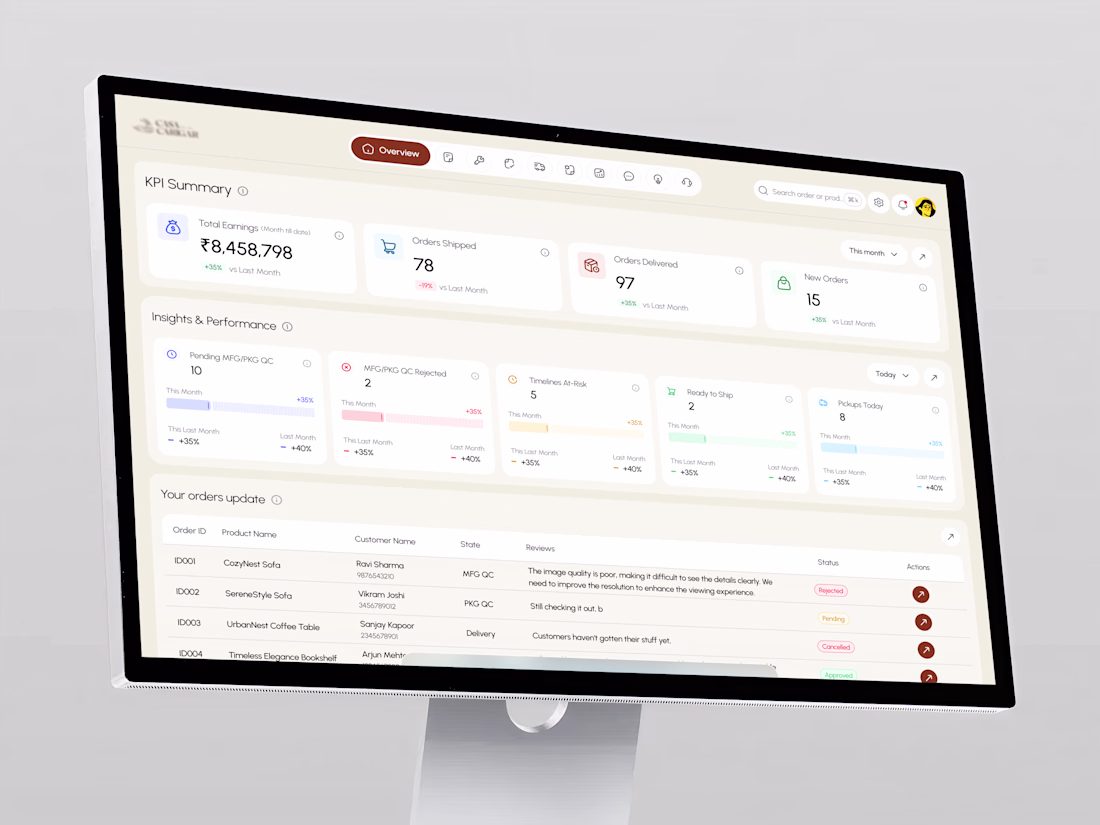
Most e-commerce dashboards show you the data. This one helps you act on it.
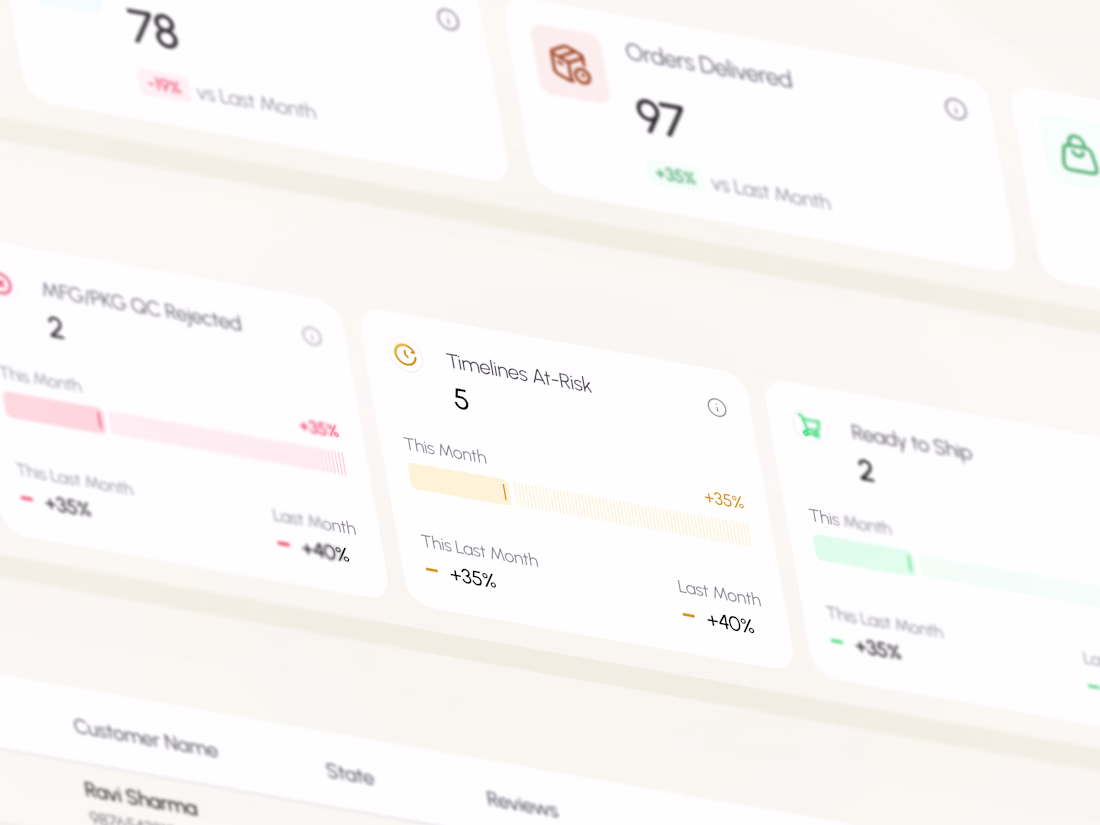
KPI summary, insights and performance, QC tracking, order status, and an AI search bar all on one warm, structured screen. Every number compared to last month. Every at-risk timeline flagged before it becomes a problem.
Cream surface. Dark brown accents. Built for the seller who needs to stay ahead of the day.
Does this feel like a dashboard your ops team would actually open first? 👇
Tools: Figma
#DashboardDesign #EcommerceUI #UIDesign #DataDashboard #ContraFreelance #ProductDesign
This look is incredibly polished.
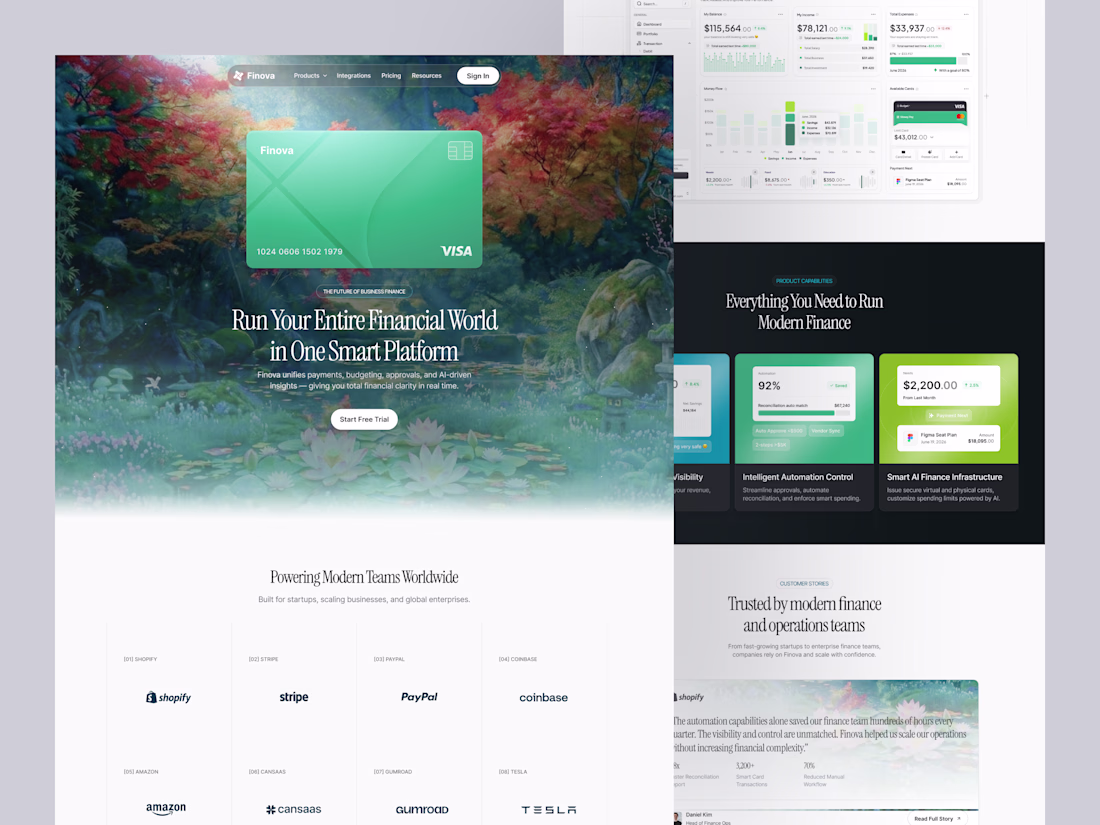
Finova is a modern finance landing page concept designed to simplify the way businesses manage payments, budgeting, approvals, and financial operations. By combining a premium editorial aesthetic with clean dashboards, AI-powered finance tools, and intuitive information architecture, the experience makes complex financial workflows feel approachable, trustworthy, and effortless. Every section is crafted to balance visual storytelling with usability, creating a scalable interface that feels both elegant and conversion-focused.
📩 Collaborate with Us? Contra Cansaas Agency
Have always trusted you for quality works like this
Data Cleaning & Excel I 5000+ Rows Cleaned I 98% Accuracy I 2 Hours
Cleaned e-commerce sales data with 450+ errors removed. Delivered clean report using Excel + Pivot table.
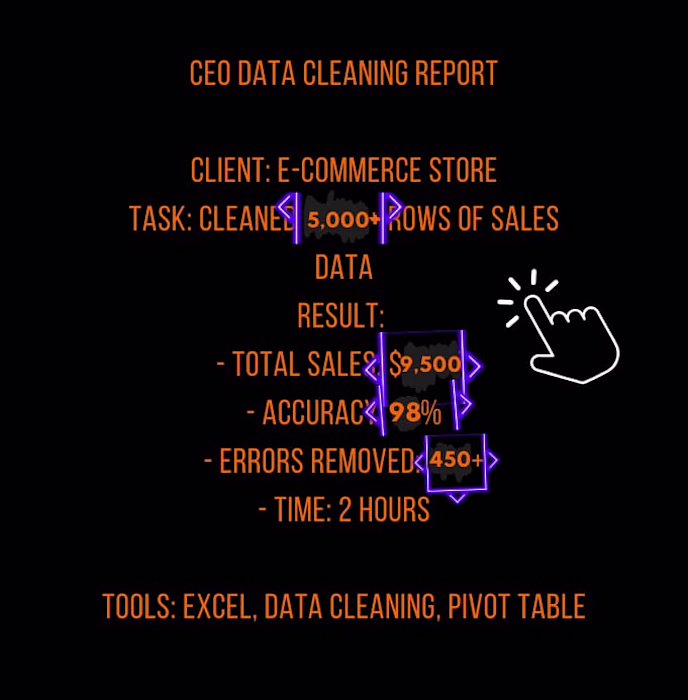
Love how you presented this with actual numbers — 5,000 rows, 450+ errors, 98% accuracy, 2 hours. That's exactly how clients need to see data cleaning work: not just 'I cleaned your data' but here's the measurable impact. The CEO-style report format is a smart touch too. Saving...
Trending
Claude
Claude has entered the design space. How are you using Claude Design?
Contra University
Learn from expert creatives how to earn more using next-gen AI tools.
MagicPath
The canvas is infinite, and exploration is becoming the workflow. How are you using MagicPath?
creativeaiflow
Creative AI workflows are evolving. What tools do you use, and what are their strengths and weaknesses?
freelancerlife
Freelancer life is wins, pivots, and everything in between. What’s yours right now?