The network for creativity
Join 1.25M professional creatives like you
Connect with clients, get discovered, and run your business 100% commission-free
Creatives on Contra have earned over $150M and we are just getting started
Back to feedPost

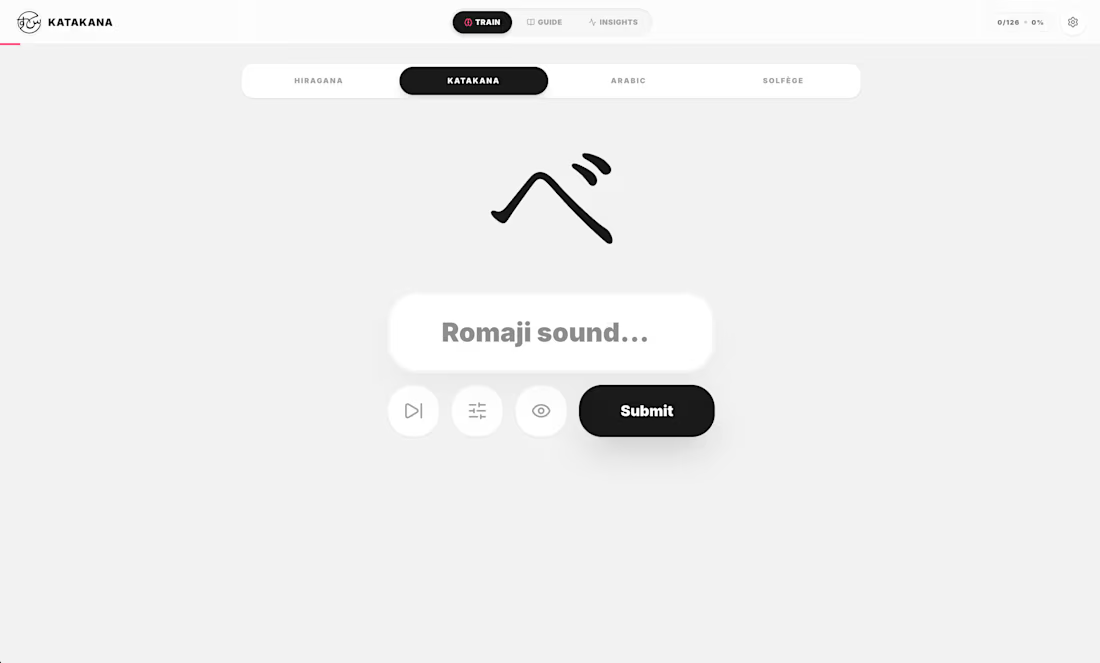
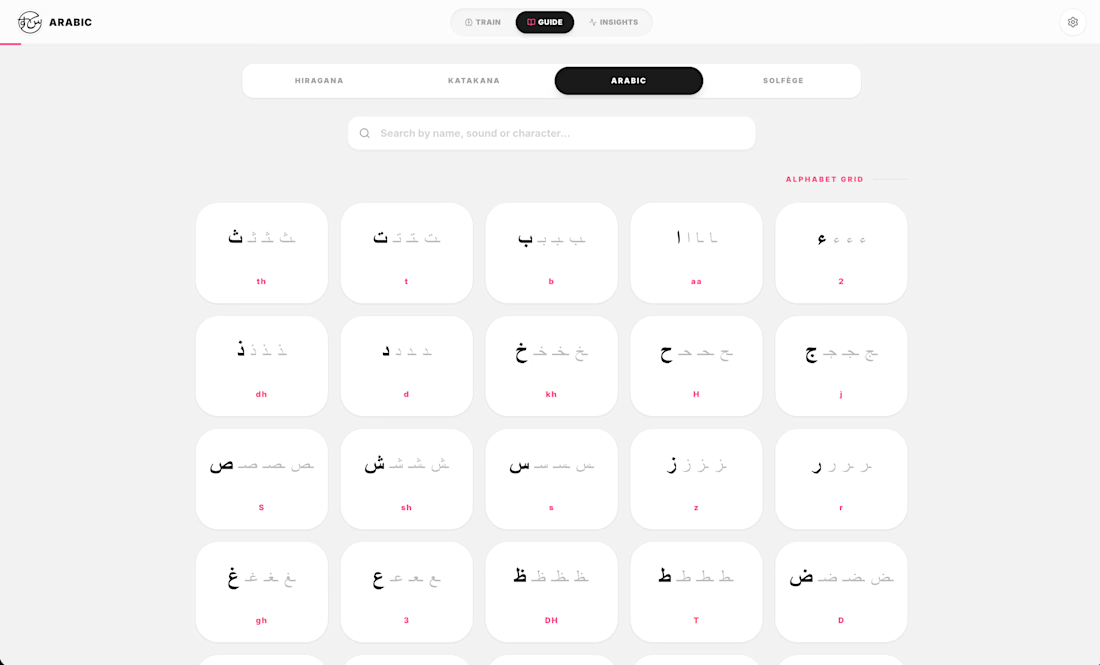
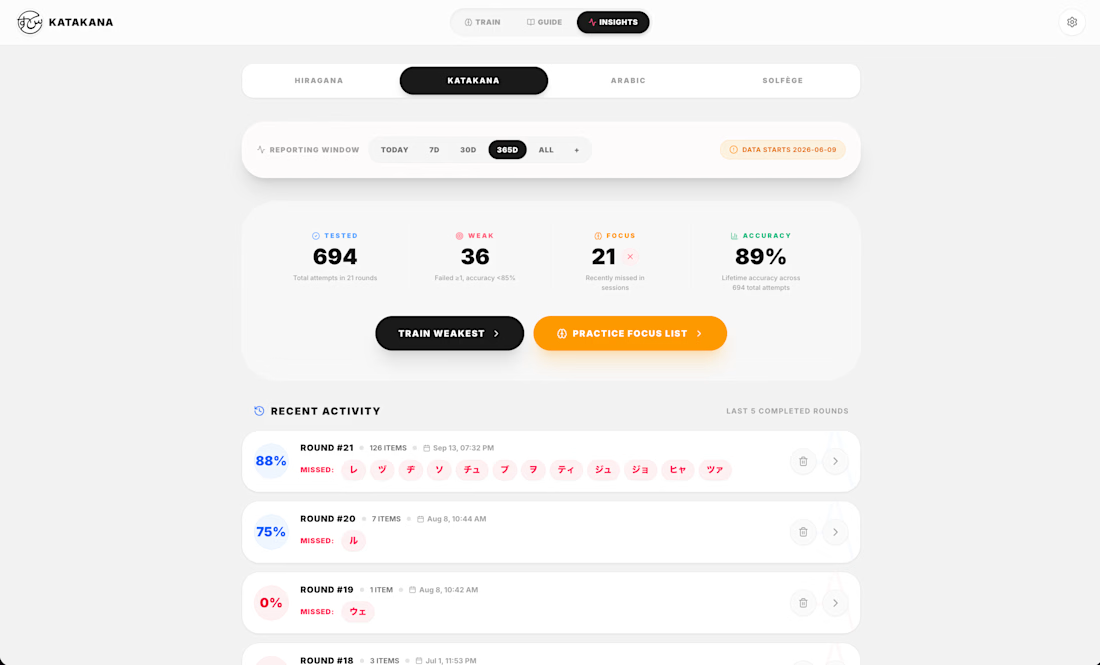
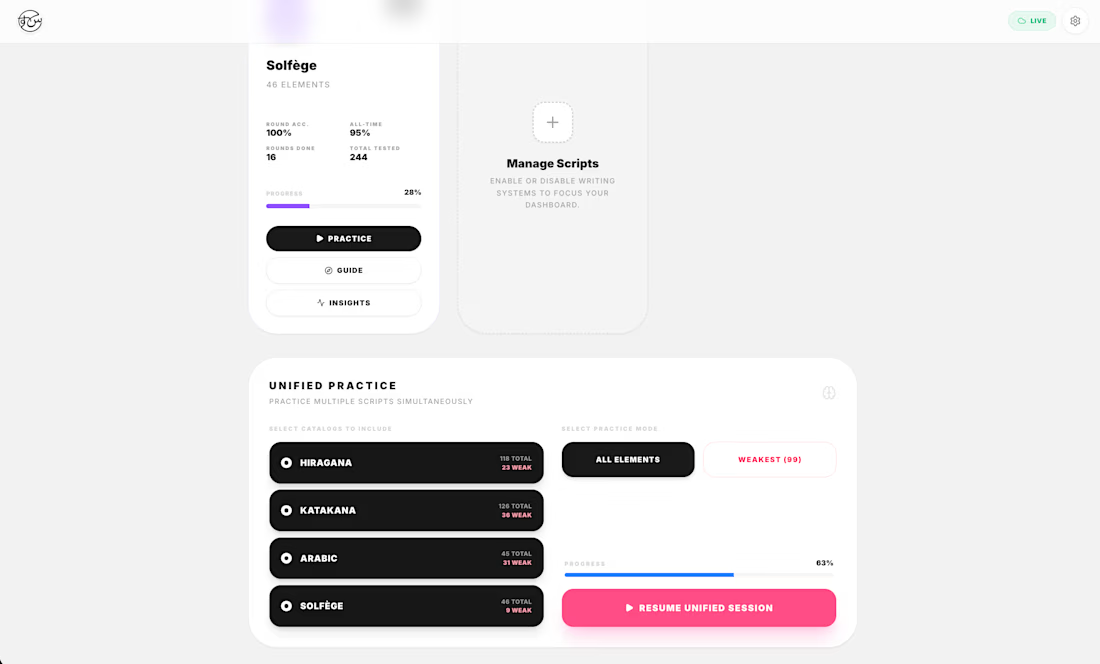
Scribo. Your focused training ground. Master Japanese Kana, Kanji, Arabic, Elvish Tengwar, Greek, Solfège, and Morse through immersive practice.


The network for creativity
Join 1.25M professional creatives like you
Connect with clients, get discovered, and run your business 100% commission-free
Creatives on Contra have earned over $150M and we are just getting started



Related posts

Crypto Portfolio Dashboard
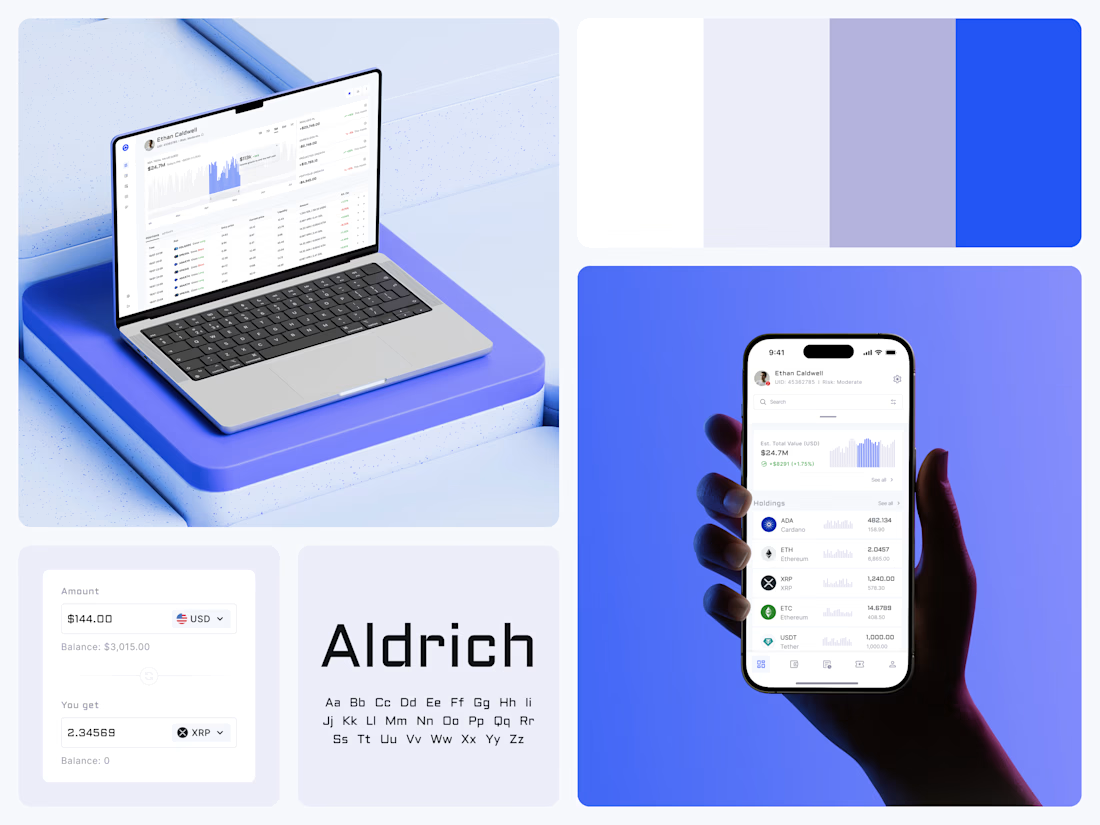
Blue means one thing here: the range you are looking at.
The value chart is a row of thin gray bars, and only the selected date range fills in blue. You read the period that matters and keep the months around it as context.
The phone carries the same chart above the holdings list. Each coin gets its own small bar chart between the name and the amount, so you can scan the whole portfolio for movement without opening a single coin.
Trading screens get busy fast. This one stays light and calm, so the numbers lead: total value, realized and unrealized P&L and open positions, all on one screen.
Designed by the Hue & Machine team.
#Crypto #Fintech #DashboardDesign #TradingPlatform #DataVisualization #UIDesign #ProductDesign #WebApp #MobileDesign #FigmaDesign



Nice Ui Dmytro


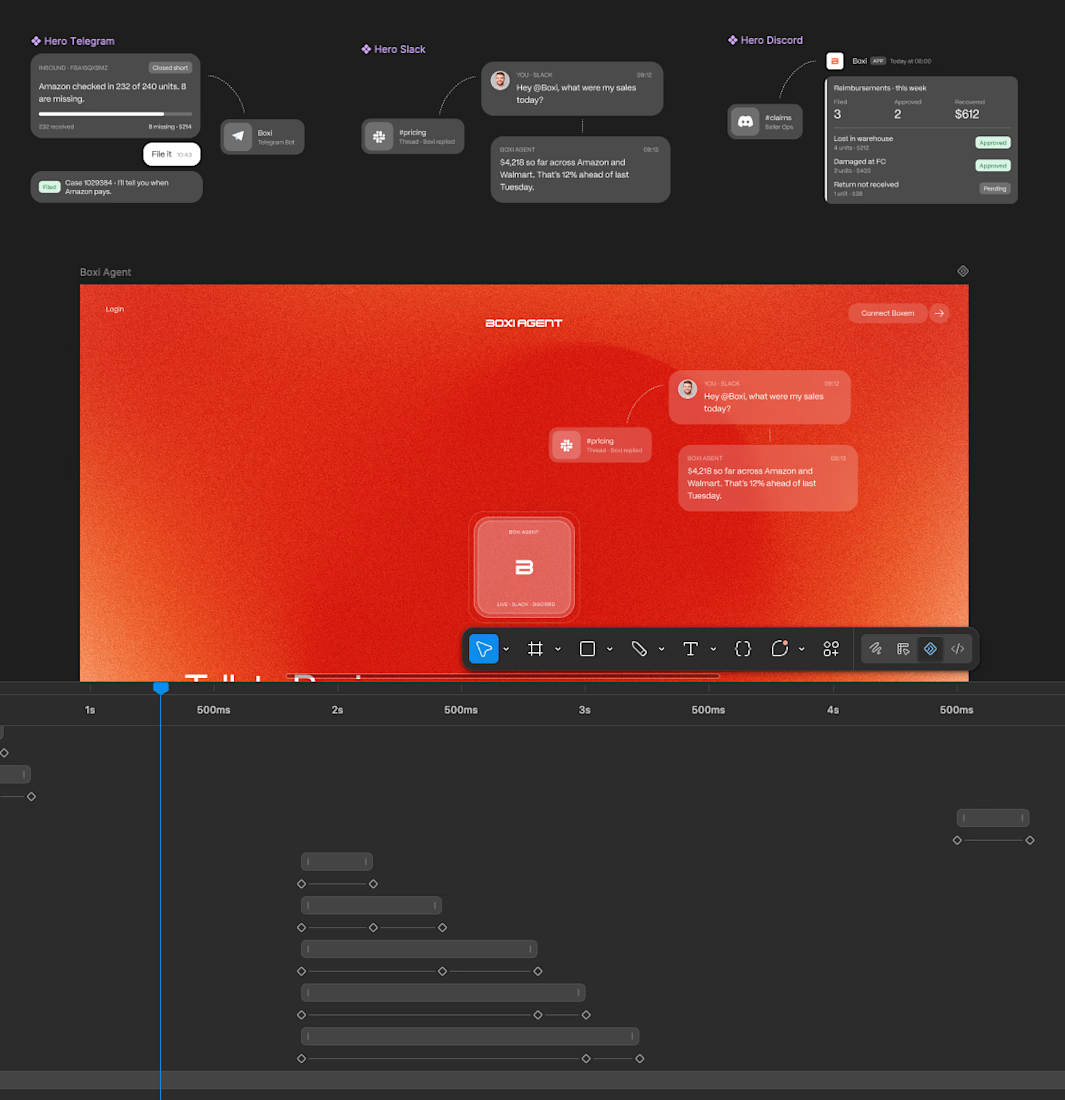
When a section relies on animation, I now prototype it in Figma motion instead of writing it out. A simple prototype gives the client and the developer the same clear reference: less back and forth, more precise feedback and a smoother build. Here’s the hero animation for a recent landing page, shown as a working prototype.

Creative work

The experience is in the details. ✨
A few interaction design explorations from my recent projects.
I’m available for new product design projects this November. If you’re building a new product or looking to improve an existing one, let’s talk.

