The network for creativity
Join 1.25M professional creatives like you
Connect with clients, get discovered, and run your business 100% commission-free
Creatives on Contra have earned over $150M and we are just getting started
Back to feedPost
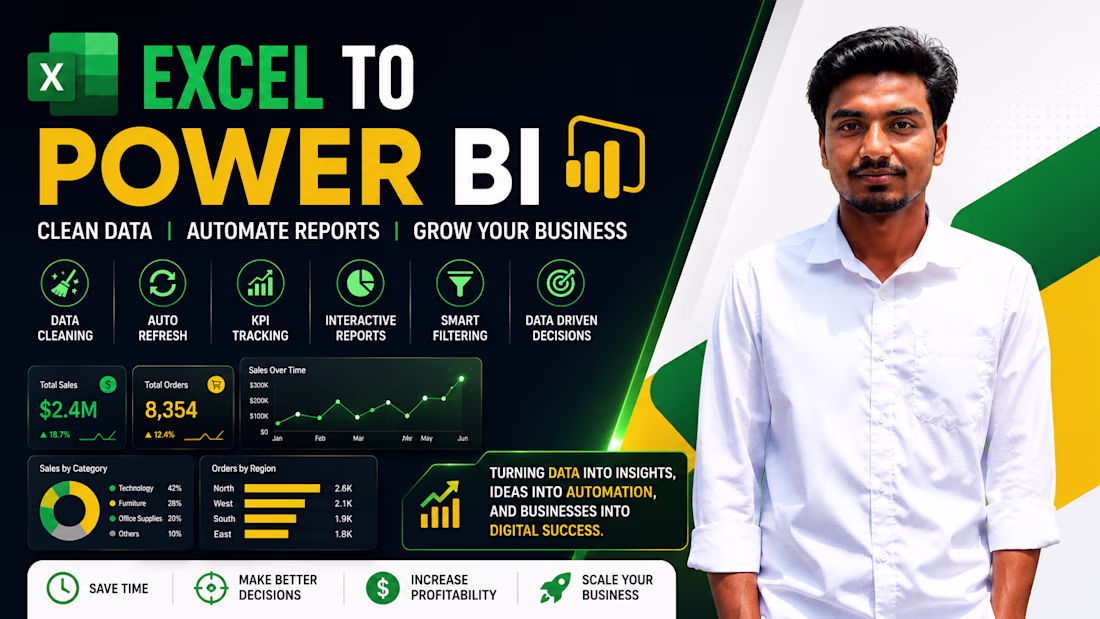
Most businesses already have data.
The problem is that the data is usually sitting inside Excel files and isn't being used effectively.
Sales reports, customer records, inventory data, marketing performance — everything is there, but finding useful insights often takes hours of manual work.
That's where Power BI can help.
I help businesses transform Excel data into interactive dashboards that are easy to understand and automatically updated.
With a well-designed dashboard, you can:
✅ Track sales and KPIs in real time
✅ Monitor business performance from one place
✅ Reduce manual reporting work
✅ Make faster, data-driven decisions
✅ Identify trends and opportunities more easily
Whether you're managing a small business, an online store, or a growing company, having clear visibility into your data can make a significant difference.
If you're still spending hours working with spreadsheets and manual reports, feel free to reach out.
#PowerBI #DataAnalytics #BusinessIntelligence #DashboardDevelopment #Excel #DataVisualization #BusinessAnalytics #ReportingAutomation
The network for creativity
Join 1.25M professional creatives like you
Connect with clients, get discovered, and run your business 100% commission-free
Creatives on Contra have earned over $150M and we are just getting started
Related posts
Presentation Exercise #2
This slide comes from a real startup pitch deck.
The headline is strong.
The data is strong.
The story is strong.
But here's the question:
If you only had 3 seconds to understand the slide...
where would your eyes go first?
👀 The headline?
👀 The 0.8% → 4.9% growth?
👀 The breakout verticals?
👀 The trend chart?
One thing I notice in presentation design:
Good slides don't just show data.
They decide what deserves attention first.
This slide does a great job of making the takeaway obvious:
Network-driven transactions grew 5× in 16 months.
Everything else supports that message.
If you were redesigning this slide, what would be the first thing you'd change?
#presentationdesign #pitchdeck #startup #storytelling #datavisualization
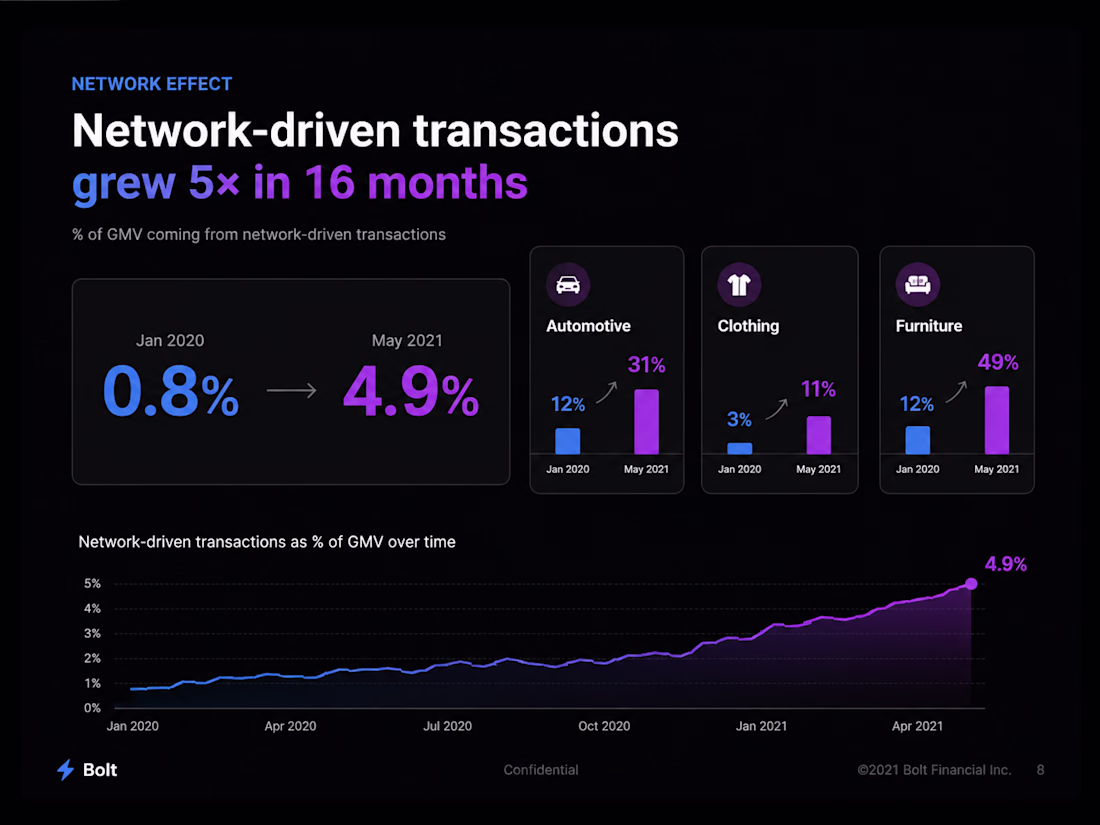
The Big Numbers always take the first attention.
🚨 EVERY RINGING PHONE IS EITHER REVENUE... OR A LOST CUSTOMER.
Most business owners think they need more leads.
Wrong.
They need to stop losing the leads already trying to buy.
Every unanswered call is a customer who moves on to your competitor.
So I built an AI Voice Agent that answers instantly, understands exactly what the customer wants, recommends the right option, books appointments automatically, and captures every lead, even when your team is unavailable.
No missed calls.
No missed opportunities.
Just faster responses and more conversations that turn into customers.
🎥 Watch the demo below.
If your business relies on phone calls, how much revenue are missed calls costing you?
Check out and follow my LinkedIn Profile Portfolio: https://www.linkedin.com/in/daniel-oluwafikayomi-famuyiwa-268a2a3a6
I expected your tagged message on this post for me. Tho I still happen to find my way here. This is good job
Power BI Sales Analytics Dashboard (4 pages)
🔗 Live Preview: View the interactive dashboard before purchase https://app.powerbi.com/view?r=eyJrIjoiYjcwNWE2OWYtM2ViZi00NDc5LTlmMTgtZWMzN2IxN2JkYTY1IiwidCI6IjYyZTI4NmIzLWE4ZDMtNDFkYS04Y2E4LWUwNzFhZTMxZGUwMiIsImMiOjl9&pageName=cd07523f864688ce9c1b
Designed to help you analyze revenue, sales performance, customer behavior, and product insights in one professional report. This editable template includes 4 interactive pages with modern visuals, KPI tracking, and dynamic filtering.
✨ What makes this dashboard special? • Clean and professional design suitable for any business • Fully editable Power BI (.pbix) file included • 4 ready-to-use pages: Business Overview, Sales Performance, Customer Analytics, Product Performance • Interactive filters and drill-down capabilities • Sample dataset included for easy customization • Perfect for portfolio, business analysis, or client reporting
Trending
Claude
Claude has entered the design space. How are you using Claude Design?
Contra University
Learn from expert creatives how to earn more using next-gen AI tools.
MagicPath
The canvas is infinite, and exploration is becoming the workflow. How are you using MagicPath?
creativeaiflow
Creative AI workflows are evolving. What tools do you use, and what are their strengths and weaknesses?
freelancerlife
Freelancer life is wins, pivots, and everything in between. What’s yours right now?